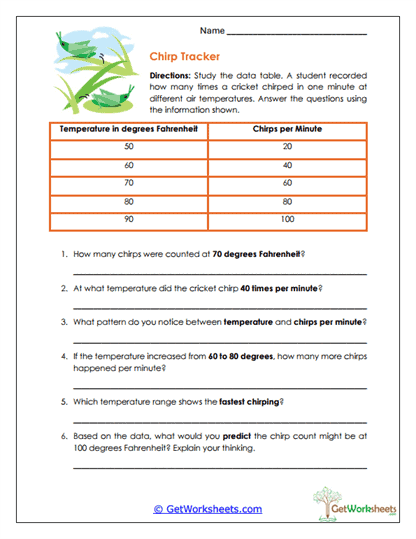
Chirp Tracker
Students study a scientific data table and answer questions using information collected from an experiment. This activity strengthens reading comprehension, data interpretation, scientific reasoning, critical thinking, and evidence-based analysis while helping learners understand how scientists organize and communicate findings. Designed for grades 4-6, the worksheet encourages students to read charts carefully, identify patterns, make comparisons, and form predictions based on data. Students learn that scientific reading often requires interpreting information presented in formats beyond traditional paragraphs.
Academic Focus
- Data Interpretation – Read and analyze information presented in tables.
- Pattern Recognition – Identify relationships and trends within data.
- Scientific Reasoning – Draw conclusions based on evidence.
- Prediction Skills – Use existing data to make logical forecasts.
Classroom & Home Use
- Supports STEM Learning – Reinforces science and math literacy skills.
- Encourages Evidence-Based Thinking – Requires answers grounded in data.
- Print-and-Go Convenience – Minimal preparation required.
- Builds Graph and Table Reading Skills – Essential for future science coursework.
- Promotes Critical Analysis – Encourages students to think beyond simple observations.
For many students, interpreting data is one of the most important skills they develop in science. This worksheet provides meaningful practice analyzing tables, recognizing trends, comparing values, making predictions, and supporting conclusions with evidence. As learners work through the questions, they strengthen comprehension, data literacy, scientific thinking, critical reasoning, and problem-solving skills that are valuable across science, math, and informational reading tasks.
Bookmark Us Now!
New, high-quality worksheets are added every week! Do not miss out!