Statistics Worksheets
About This Worksheet Collection
Statistics helps students make sense of information by organizing data, describing patterns, comparing values, and drawing conclusions from evidence. The subject moves beyond simply performing calculations; learners must understand what numerical information represents, how it can be summarized, and what can reasonably be inferred from it. This collection introduces those ideas through frequency tables, averages, measures of center and spread, data interpretation, probability, and applied probability problems.
The worksheets span both descriptive statistics and introductory probability. Students organize raw observations into frequency tables, interpret graphs and surveys, calculate and analyze mean, median, mode, and range, compare distributions, evaluate data-based claims, classify likelihood, calculate theoretical and experimental probabilities, and solve contextual chance problems. Activities range from straightforward tally counting and average calculations to outlier analysis, grouped data, compound probability, expected frequencies, and evidence-based reasoning.
Taken together, these topics develop a broader understanding of how data and chance are used to describe the world. Students learn to summarize numerical information without losing important details, recognize that different statistical measures reveal different features of a data set, and distinguish mathematical evidence from unsupported assumptions. These skills provide a strong foundation for graphing, probability, scientific investigations, data analysis, distributions, variability, statistical modeling, and later work in mathematics and science.
Detailed Descriptions Of These Worksheets
Frequency Tables
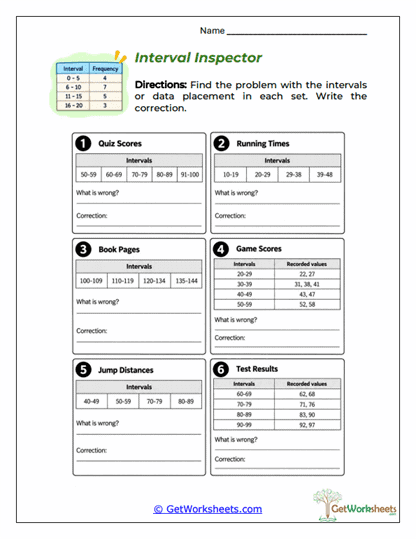
These worksheets show students how raw observations can be organized into categories, tally marks, frequencies, and numerical intervals. Learners complete tables, check totals, identify missing entries, group scores, transfer information from graphs, and work with relative frequency. More advanced activities introduce class intervals, modal classes, and error analysis. The collection builds the organizational skills needed before students interpret larger data displays and distributions.
Interpreting Data
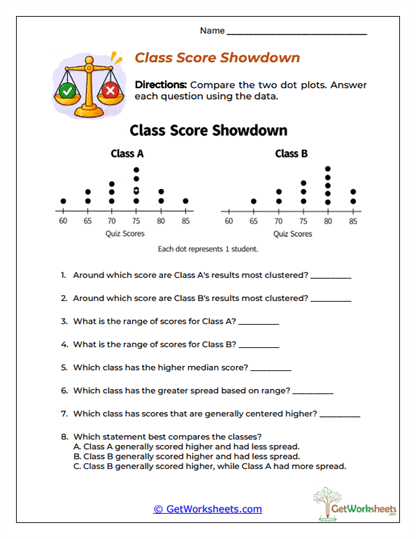
Graphs, tables, surveys, dot plots, and statistical summaries become sources of evidence students must analyze carefully. Learners compare values, identify trends, calculate totals and differences, examine center and spread, and determine whether conclusions are supported by the available information. Several activities deliberately introduce misleading or incomplete claims so students must distinguish observation from assumption. This collection emphasizes statistical reasoning rather than simply locating numbers in a display.
Mean
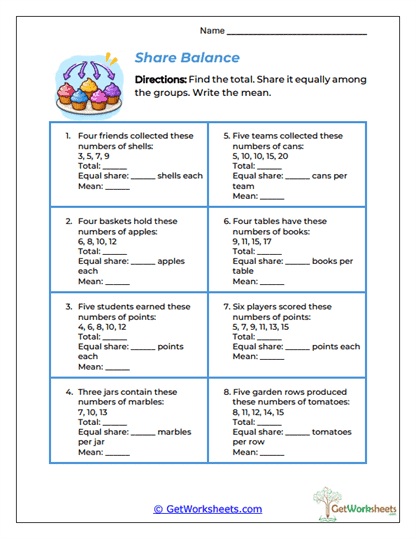
Arithmetic mean is developed both as a calculation and as an equal-share interpretation of a data set. Students find averages, organize the steps of sum-count-divide, work backward to determine missing values, compare means, and investigate how changing values or introducing outliers affects the result. Target-average problems add inverse reasoning and early algebraic thinking. These worksheets help learners understand the relationship among a data set's total, number of observations, and average.
Median, Mode, and Range
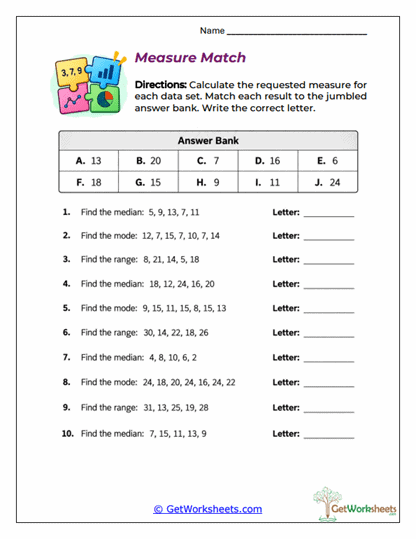
Students explore three different ways of describing numerical data. They order values to locate medians, analyze repetition to identify modes, and compare minimum and maximum values to calculate range. Later activities introduce even-sized data sets, multiple modes, missing values, error correction, changing distributions, and combined statistical analysis. The collection reinforces that each measure communicates something different about center, frequency, or spread.
Probability
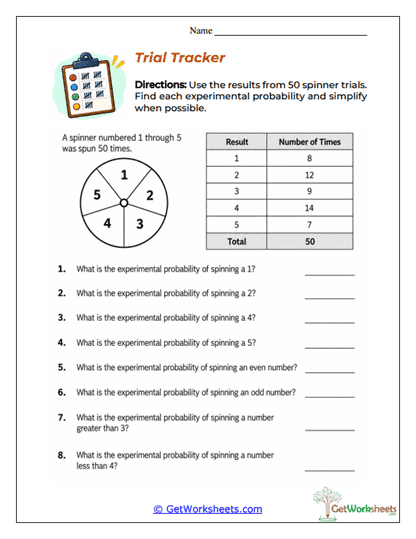
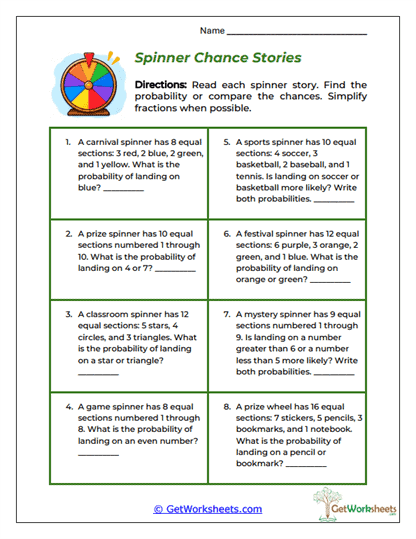
Chance is introduced through descriptive likelihood before progressing to numerical probability and more complex random events. Students work with probability scales, fractions, sample spaces, spinners, coins, number cubes, experimental results, expected frequencies, and compound events. They also compare theoretical and experimental probability and analyze common reasoning errors. These worksheets build a systematic understanding of how possible and favorable outcomes determine likelihood.
Probability Word Problems
Written scenarios require students to extract probability information before choosing a mathematical strategy. Problems involve cards, counters, spinners, number cubes, carnival games, experimental trials, complementary events, compound events, and missing quantities. Learners identify sample spaces, calculate and compare probabilities, predict expected outcomes, and distinguish observed results from theoretical expectations. The collection strengthens reading comprehension alongside fraction reasoning, proportional thinking, and probability analysis.
Bookmark Us Now!
New, high-quality worksheets are added every week! Do not miss out!