Probability Worksheets
About This Worksheet Collection
Probability gives students a mathematical way to describe uncertainty, compare possible outcomes, and make predictions about events that have not yet happened. Beginning with everyday language such as impossible, unlikely, equally likely, likely, and certain, learners gradually connect those ideas to numerical values between 0 and 1. This collection builds that understanding through coins, number cubes, spinners, colored counters, sample spaces, repeated trials, and other familiar chance-based situations.
The activities progress from describing likelihood to calculating theoretical and experimental probabilities, organizing complete sample spaces, comparing probability forms, and examining compound events. Students place events on probability scales, simplify probability fractions, compare predicted and observed results, calculate expected frequencies, analyze multistage experiments, and correct flawed reasoning. Matching, error analysis, tree diagrams, frequency tables, and cumulative review keep the practice varied while reinforcing the same underlying principles.
Across the collection, students learn that probability depends on both favorable outcomes and the complete set of possible outcomes. They also discover that theoretical expectations may differ from experimental results, that repeated independent events are not controlled by previous outcomes, and that compound experiments require careful organization of every possible combination. These ideas support later work with fractions, proportions, simulations, probability distributions, statistical inference, experimental data, and more advanced analysis of random events.
Detailed Descriptions Of These Worksheets
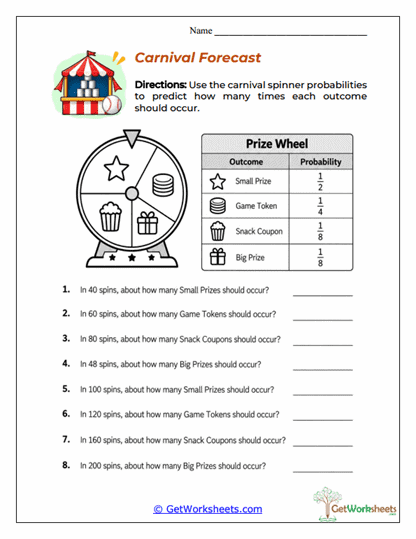
Carnival Forecast
A carnival prize wheel provides the probabilities students use to predict expected numbers of prizes over repeated spins. Learners multiply each event's probability by the total number of trials to estimate how often an outcome should occur. Different spin totals show how expected frequencies scale proportionally as the number of trials changes. The activity also reinforces that an expected result is a mathematical prediction rather than a guarantee of what will happen.
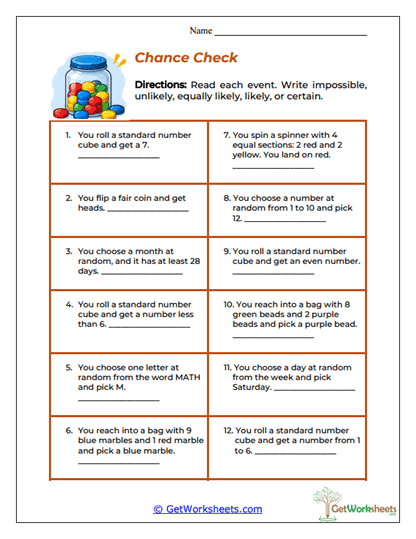
Chance Check
Everyday chance situations are classified as impossible, unlikely, equally likely, likely, or certain. Coins, number cubes, marbles, spinners, dates, and random selections give students varied opportunities to judge likelihood without first performing calculations. Comparing favorable outcomes with all possible outcomes helps justify each classification. This introductory activity establishes the vocabulary students need before working with numerical probabilities.
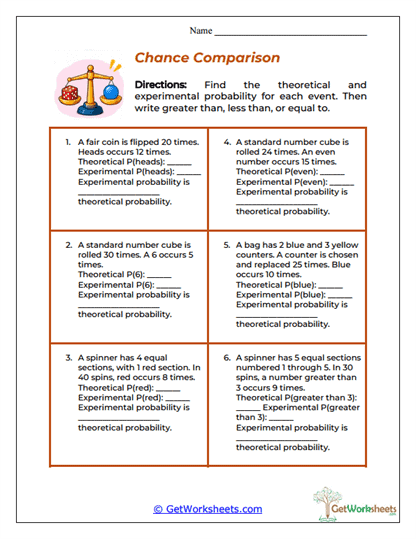
Chance Comparison
Students calculate both theoretical and experimental probability for the same event and then compare the two values. Coins, number cubes, spinners, and counters provide familiar experiments while recorded trial results supply the observed data. Learners decide whether the experimental result is greater than, less than, or equal to the theoretical expectation. The comparison introduces random variation and shows why actual results do not always match mathematical predictions exactly.
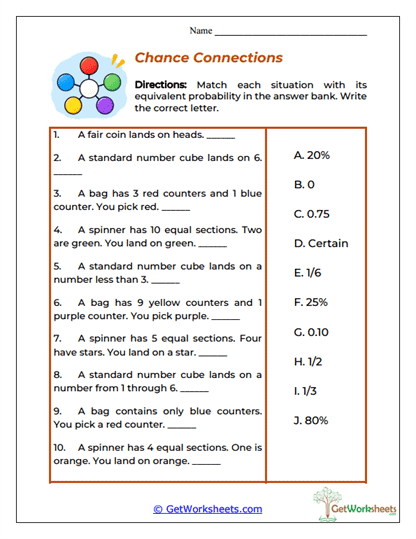
Chance Connections
Probability situations are matched with equivalent numerical representations from an answer bank. Fractions, decimals, percentages, zero, and certainty all appear, requiring students to recognize different forms of the same likelihood. Calculating each probability first helps learners determine which representation belongs with the event. This activity links probability with broader number concepts and proportional reasoning.
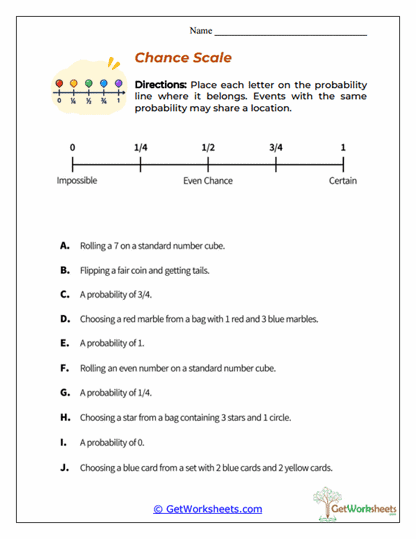
Chance Scale
Events are positioned on a probability number line ranging from 0 to 1. Students connect fractional values such as 1/4, 1/2, and 3/4 with the relative likelihood of coins, number cubes, spinners, and other random outcomes. Multiple events may belong at the same location when their probabilities are equivalent. The visual scale makes the progression from impossible to certain easier to interpret.
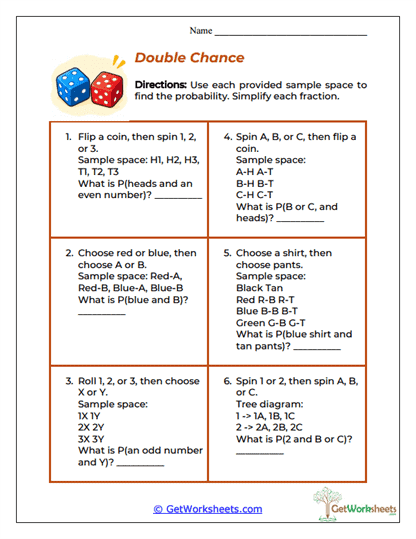
Double Chance
Compound probability problems involve two-stage experiments and organized sample spaces. Students use outcome lists or tree diagrams to identify all possible combinations and determine which satisfy a stated condition. Favorable compound outcomes are compared with the complete sample space and expressed as simplified fractions. The worksheet lays groundwork for independent events and more formal compound probability methods.
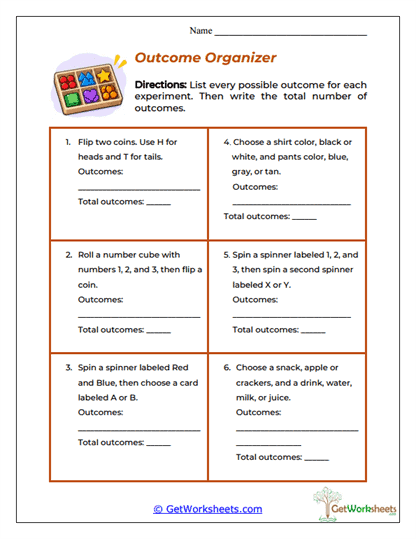
Outcome Organizer
Students systematically list every possible result of experiments involving coins, number cubes, spinners, cards, clothing choices, and food combinations. Some situations contain more than one stage, so careful organization is necessary to avoid omissions or duplicates. After constructing the sample space, learners determine the total number of possible outcomes. This activity emphasizes that accurate probability begins with knowing exactly what can happen.
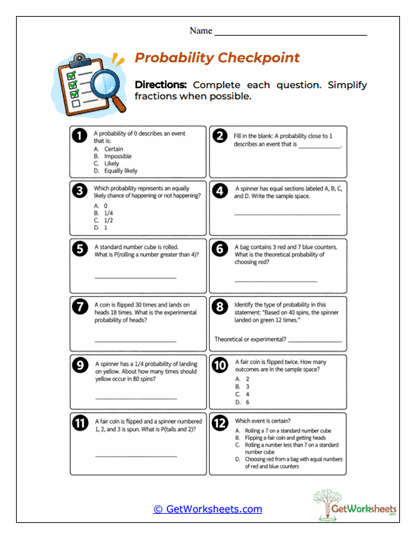
Probability Checkpoint
A cumulative review combines probability vocabulary, scales, sample spaces, theoretical and experimental probability, expected outcomes, and compound events. Coins, number cubes, spinners, and counters appear throughout multiple-choice, numerical, and short-response questions. Students must decide which probability idea applies before completing each task. The varied format makes the worksheet useful for end-of-unit assessment or identifying specific misconceptions.
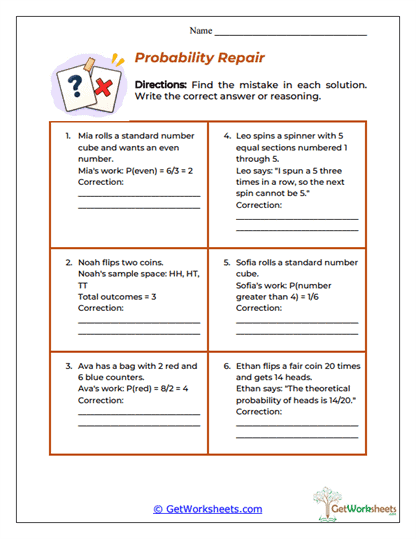
Probability Repair
Incorrect probability reasoning becomes the focus of six investigative problems. Students examine mistakes involving reversed fractions, incomplete sample spaces, faulty predictions, independence, or confusion between theoretical and experimental probability. Each error must be identified and replaced with a mathematically supported correction. Analyzing flawed work encourages deeper understanding than simply repeating routine calculations.
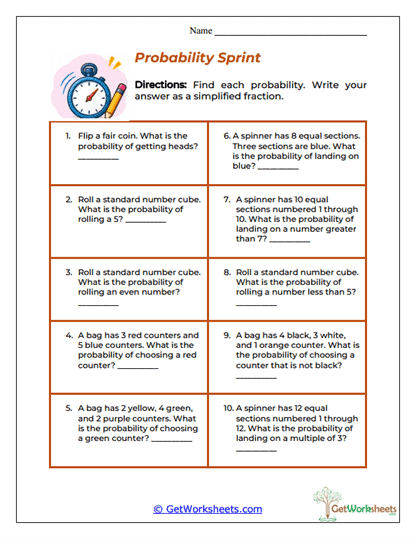
Probability Sprint
Ten focused problems ask students to calculate theoretical probability as a simplified fraction. Learners count favorable outcomes and total equally likely outcomes for coins, number cubes, counters, and spinners while also applying number properties such as parity and multiples. Reducing each probability reinforces fraction skills alongside chance calculations. The concise format provides concentrated practice with the standard probability formula.
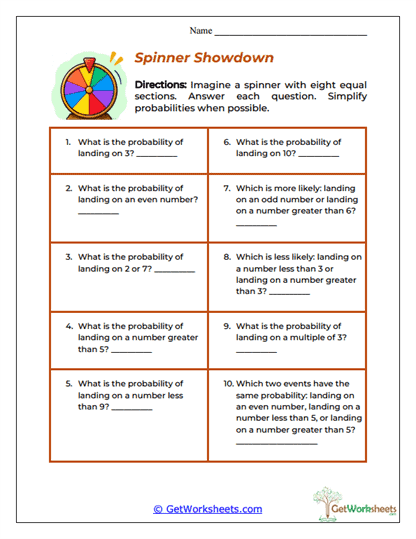
Spinner Showdown
An eight-section numbered spinner serves as the consistent model for a variety of probability questions. Students calculate chances involving individual values, even and odd numbers, ranges, multiples, and combined numerical conditions. Several questions require them to compare which of two events is more likely or recognize equal probabilities. Using one fixed sample space lets learners focus on increasingly sophisticated outcome analysis.
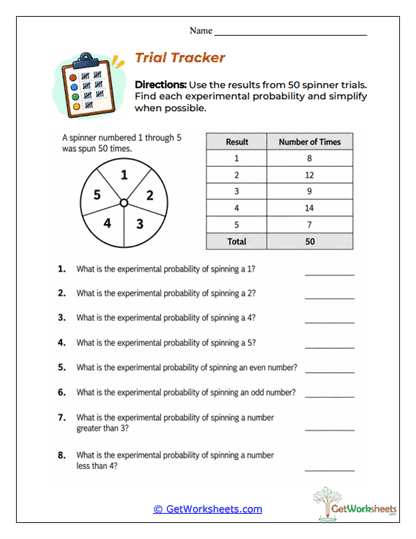
Trial Tracker
A frequency table records the results of 50 spinner trials, giving students data for calculating experimental probabilities. Learners determine probabilities for individual numbers as well as combined events such as even, odd, or range-based outcomes. Frequencies are divided by the total number of trials and simplified when appropriate. The worksheet connects earlier work with frequency tables to probability based on actual observed results.
Bookmark Us Now!
New, high-quality worksheets are added every week! Do not miss out!