Frequency Tables Worksheets
About This Worksheet Collection
Frequency tables help students turn scattered observations into organized information that is easier to count, compare, and interpret. By grouping data into categories or numerical intervals and recording how often each value occurs, learners begin to see how raw data can be summarized without losing its meaning. This collection develops that foundation through tally marks, categorical tables, grouped distributions, graph-to-table transfers, error analysis, relative frequency, and introductory statistical interpretation.
The worksheets move from elementary tally counting into progressively more sophisticated data work. Students construct and complete frequency tables, count observations, identify missing values, check totals, detect errors, sort scores into class intervals, interpret survey results, transfer information from graphs, identify modes and modal classes, and express relative frequencies as fractions, decimals, and percentages. The range of formats gives learners experience with both categorical data and numerical distributions while reinforcing careful counting and organization.
Across the collection, students learn that accurate statistics depends on more than simply recording numbers. They practice checking that frequencies match the original data, choosing the correct interval for each observation, comparing categories, interpreting grouped information, and recognizing how absolute frequency differs from relative frequency. These skills prepare students for bar graphs, pictographs, histograms, measures of center, probability, data comparisons, and more advanced statistical analysis.
Detailed Descriptions Of These Worksheets
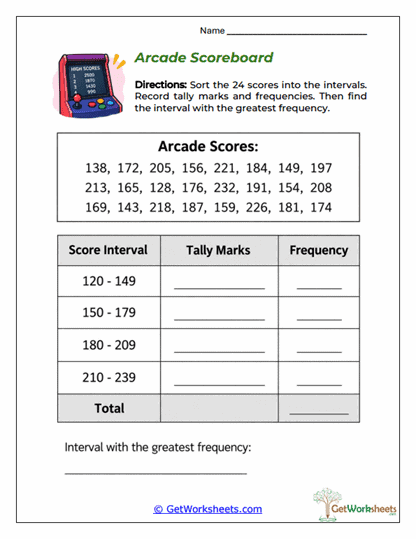
Arcade Scoreboard
Arcade scores are sorted into predetermined numerical intervals to create a grouped frequency distribution. Students record tally marks, calculate the frequency for each score range, and verify that every observation has been classified. They then compare the intervals to identify the modal class, or the range containing the most scores. The game-based setting gives grouped data practice a lively and accessible context.
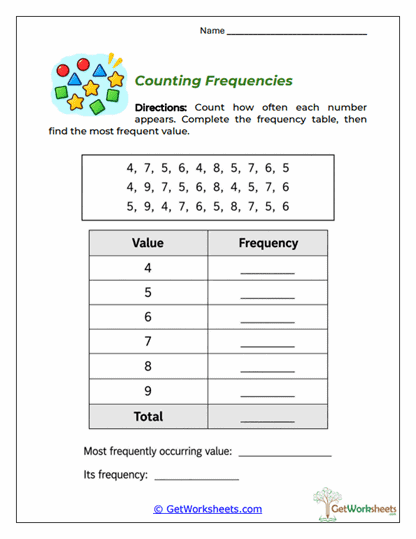
Counting Frequencies
An unsorted collection of numbers must be organized according to how often each value appears. Students record frequencies for values from 4 through 9, calculate the total number of observations, and identify the mode. Working directly from raw numerical data requires systematic counting and careful tracking. The worksheet introduces the connection between a frequency table and one of the most basic measures of statistical frequency.
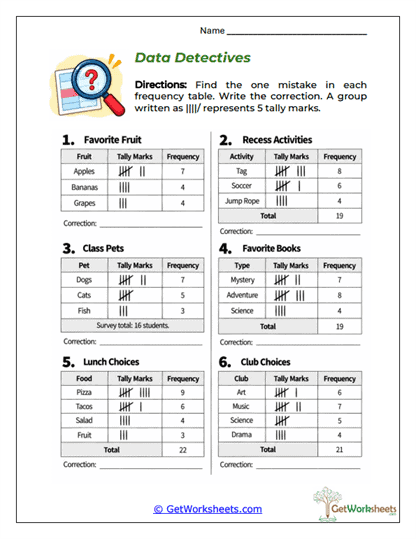
Data Detectives
Each frequency table contains an intentional mistake that students must locate and correct. Errors may involve mismatched tally marks, incorrect numerical frequencies, or totals that do not agree with the recorded categories. Rather than simply completing a table, learners evaluate whether the information is internally consistent. The detective format strengthens attention to detail, verification habits, and evidence-based statistical reasoning.
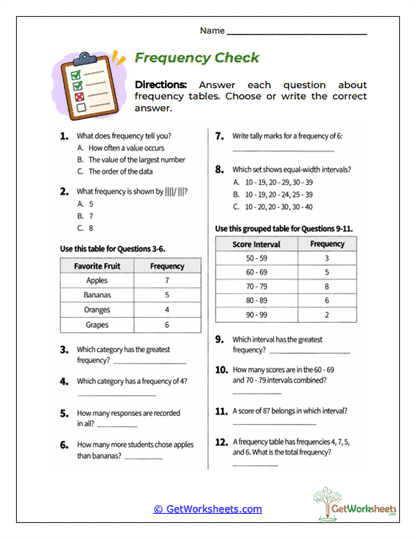
Frequency Check
A varied set of questions reviews tally marks, frequency tables, categorical data, grouped intervals, and data interpretation. Multiple-choice items, short responses, and calculations require students to demonstrate understanding in several different ways. The worksheet moves between basic concepts and more advanced grouped-data ideas, making it useful for cumulative review. It can also reveal whether a student's difficulty lies in counting, interpretation, interval structure, or statistical vocabulary.
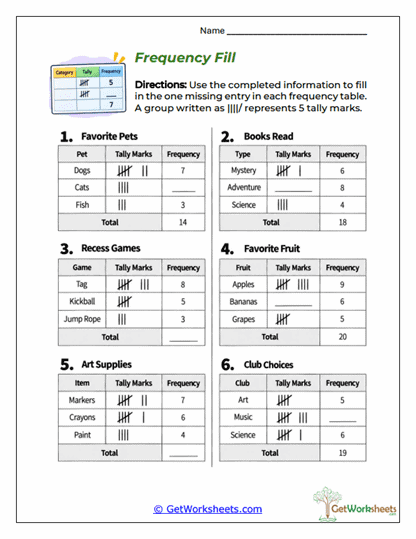
Frequency Fill
Partially completed frequency tables ask students to supply missing tallies, numerical frequencies, or totals. The themed data sets include pets, books, games, fruit, art supplies, and club choices, giving the practice a variety of familiar contexts. Learners must use the information already present in each table to reason out what is missing. This format develops both arithmetic accuracy and understanding of how individual category frequencies contribute to an overall data set.
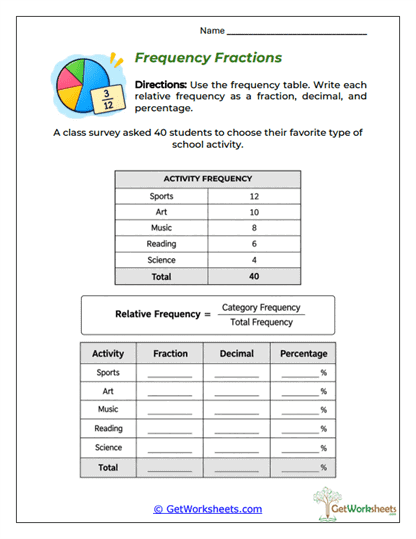
Frequency Fractions
Students move beyond simple counts by expressing each category's frequency as a fraction of the total, a decimal, and a percentage. A completed class survey provides the raw frequencies, allowing learners to focus on relative frequency rather than data collection. The conversions connect statistics with division, fractions, decimals, percentages, and proportional reasoning. This worksheet provides an important bridge from elementary frequency tables to probability and comparative data analysis.
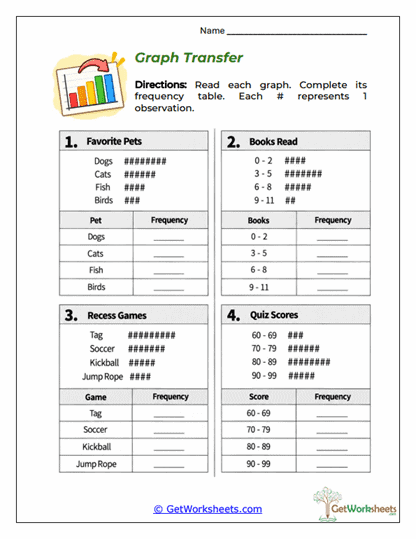
Graph Transfer
Information from visual data displays is converted into organized frequency tables. Students count symbols, identify categories or intervals, and transfer the corresponding totals without changing the underlying data. Working between two representations reinforces the idea that the same data can be displayed in different forms. The activity strengthens graph reading, classification, counting accuracy, and statistical translation.
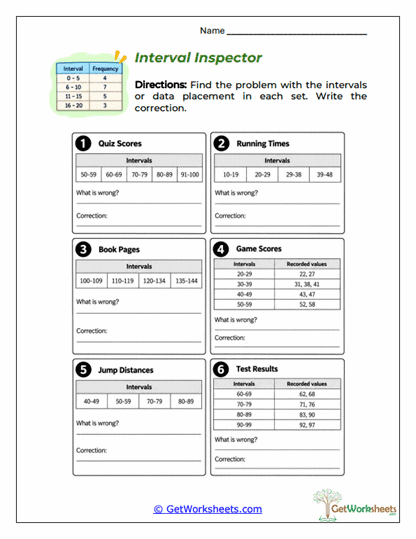
Interval Inspector
Grouped data displays are examined for problems involving class intervals. Students look for gaps, overlaps, inconsistent widths, and observations that have been placed in the wrong range. Correcting these issues requires an understanding of interval boundaries rather than routine counting alone. The worksheet develops the careful structural reasoning students will need when creating and interpreting histograms and grouped distributions.
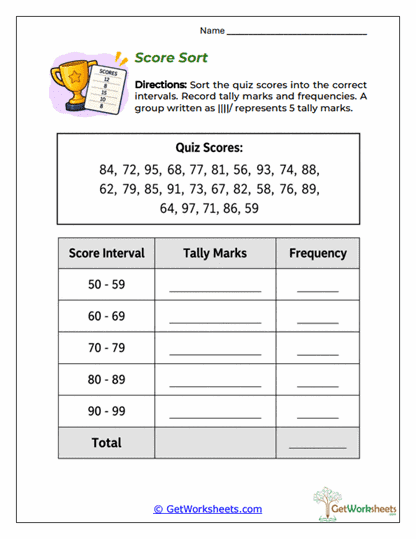
Score Sort
Quiz scores are organized into class intervals ranging from lower to higher score bands. Students decide where each score belongs, record tally marks, calculate interval frequencies, and check the overall total. This marks a shift from frequency tables based on individual categories to grouped numerical data. The activity helps students understand how larger data sets can be summarized efficiently without listing every score separately.
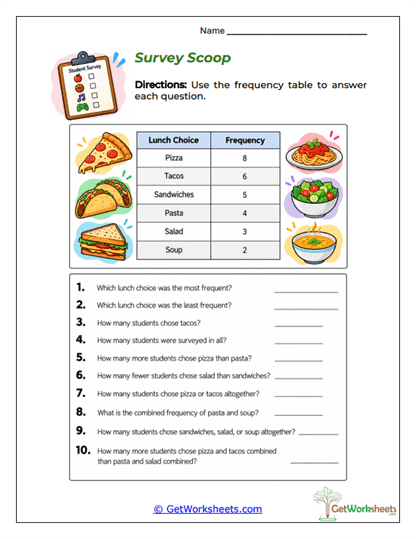
Survey Scoop
A completed lunch-preference frequency table becomes the basis for a series of interpretation questions. Students identify the most and least common choices, compare category frequencies, combine counts, and calculate differences or totals. Because the data are already organized, the emphasis is on extracting information and drawing numerical conclusions. The worksheet shows how frequency tables can be used to answer meaningful questions about survey results.
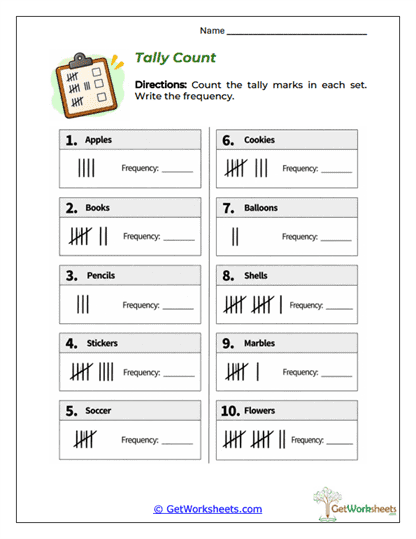
Tally Count
Sets of tally marks are converted into numerical frequencies. Students practice recognizing groups of five, counting on from completed groups, and recording the correct total for each category. The straightforward format builds fluency with the visual notation used in many elementary data activities. It also strengthens the number sense needed before students begin constructing frequency tables independently.
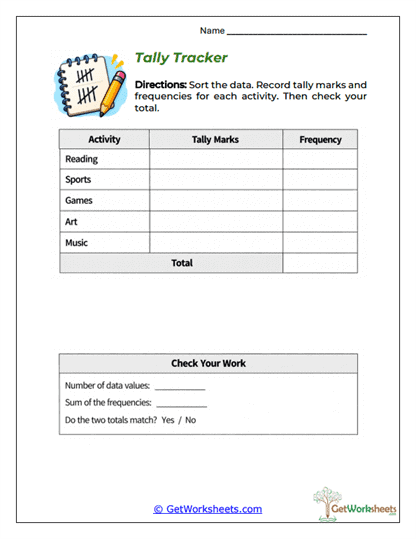
Tally Tracker
Students organize categorical information using both tally marks and numerical frequencies. Familiar categories such as reading, sports, games, art, and music make the data easy to interpret while learners practice recording and totaling observations. A final check asks students to compare the sum of the frequencies with the number of data values. This introductory activity establishes the full process of moving from raw categorical information to an organized statistical summary.
Bookmark Us Now!
New, high-quality worksheets are added every week! Do not miss out!