Graphing Worksheets
About This Worksheet Collection
Graphing helps students organize information, recognize patterns, compare values, and describe mathematical relationships visually. Depending on the graph type, learners may work with categories, coordinates, changes over time, percentages, symbols, trends, or equations. These skills support data literacy, number sense, geometry, algebra, statistics, and real-world problem solving.
This collection brings together several major graphing topics for elementary through middle school learners. Students practice with coordinate planes, bar graphs, line graphs, lines of best fit, picture graphs, and pie graphs, giving them experience with both creating and interpreting visual data displays. The worksheets can be used for classroom instruction, math centers, homework, review, intervention, tutoring, independent practice, or homeschool lessons.
As students work through the collection, they strengthen graph reading, scale interpretation, data comparison, plotting, percentage reasoning, coordinate skills, trend analysis, and mathematical communication. They also practice choosing important information, connecting numbers to visual displays, identifying patterns, checking graph accuracy, and solving questions based on represented data. Together, these topics help learners become more confident using graphs as tools for understanding and explaining mathematical information.
Detailed Descriptions Of These Worksheets
Bar Graphs
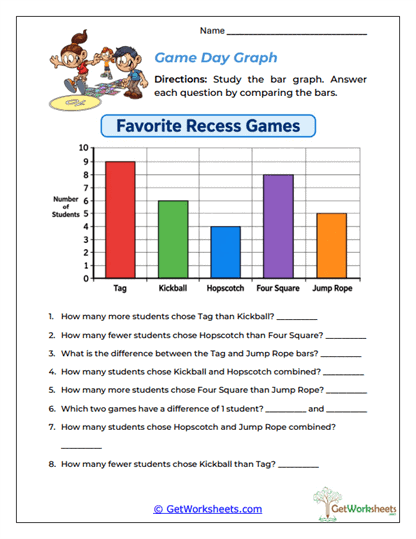
Bar graphs help students compare categories by representing values with rectangular bars. Learners practice reading bar heights, interpreting scales, finding differences, combining categories, and identifying the greatest or least values. Activities also include creating graphs from data, completing missing bars, choosing appropriate scales, and checking graphs for errors. The collection is especially useful for grades 2-5 and builds data literacy alongside addition, subtraction, comparison, and number sense.
Coordinate Planes
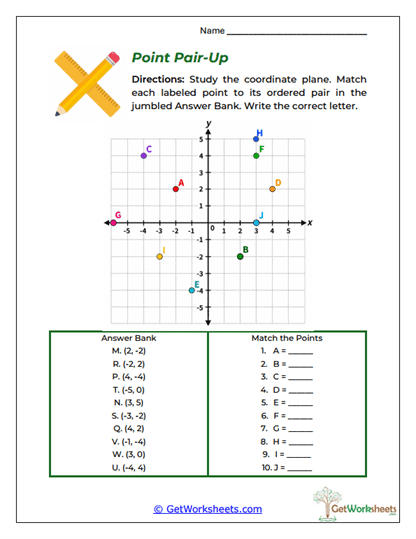
Coordinate plane worksheets help students describe exact locations using ordered pairs, axes, quadrants, and positive and negative numbers. Learners identify the x-axis, y-axis, origin, and four quadrants before progressing to reading, plotting, reflecting, comparing, and measuring coordinate points. Activities also include recognizing horizontal and vertical relationships, finding distances, checking graphing mistakes, and solving coordinate clues. These worksheets are especially useful for late elementary and middle school learners that are developing spatial reasoning and early coordinate geometry skills.
Line Graphs
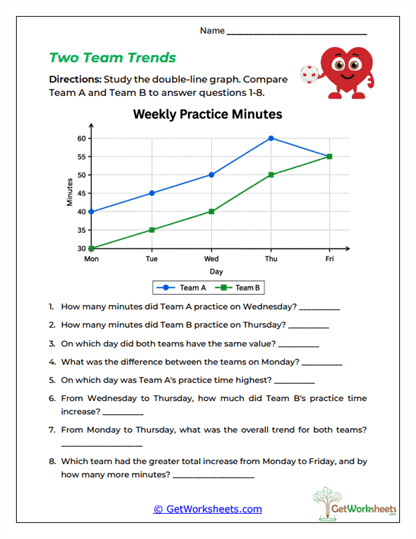
Line graphs show how data changes across time or another ordered sequence. Students practice reading axes and scales, identifying data points, recognizing increases and decreases, finding high and low values, and describing overall trends. The collection also includes graph construction, scale selection, error checking, double line graphs, and multi-step interpretation. These activities are well suited for grades 4-5 and connect graphing with measurement, subtraction, comparison, and early rate-of-change thinking.
Line of Best Fit
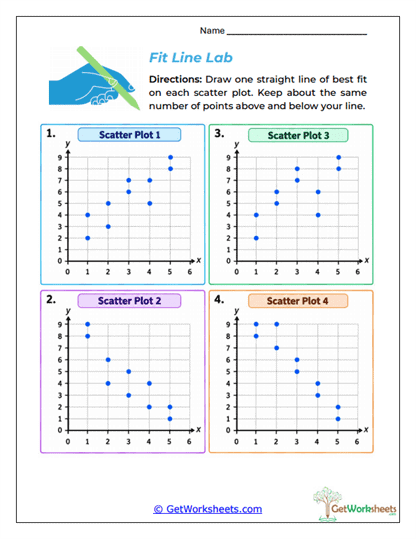
Line-of-best-fit worksheets introduce students to scatter plots, correlation, trend lines, slope, and predictive modeling. Learners identify positive, negative, or weak relationships before drawing and evaluating reasonable best-fit lines. More advanced activities include writing linear equations, interpreting slope in context, analyzing outliers, distinguishing interpolation from extrapolation, and making predictions from models. This collection is designed mainly for middle school learners working with algebra, statistics, and data analysis.
Picture Graphs
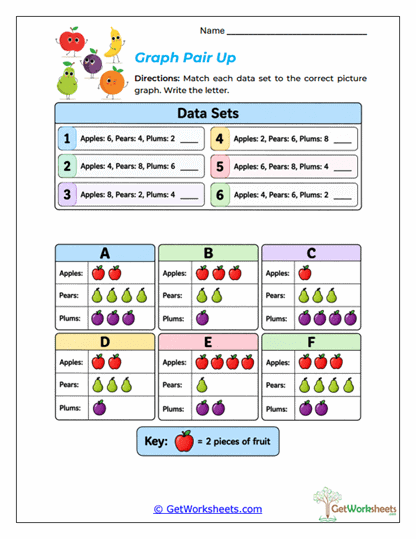
Picture graphs use symbols to represent category amounts and provide an accessible introduction to data displays for younger learners. Students identify graph parts, count symbols, interpret keys, compare categories, complete missing rows, and build scaled pictographs from data. More advanced activities include half symbols, error checking, scaled keys, and matching numerical data with picture graphs. These worksheets are especially useful for grades 2-3 and reinforce counting, skip counting, addition, subtraction, early multiplication, fractions, and data reasoning.
Pie Graphs
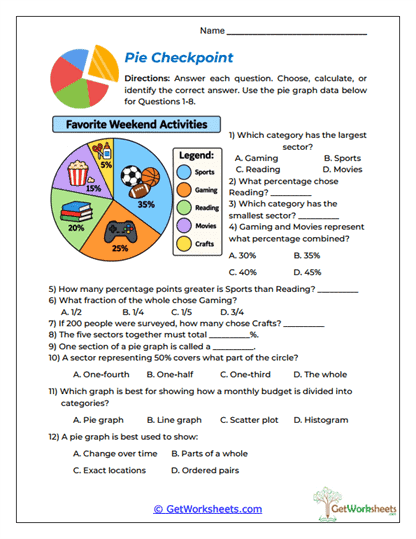
Pie or circle graphs help students understand how a whole is divided among categories. Learners work with sectors, percentages, fractions, legends, category totals, and part-to-whole relationships while reading and comparing circular graphs. Activities include finding missing percentages, converting counts to percentages, calculating actual amounts from sectors, matching fraction-percent equivalents, checking graph errors, analyzing budgets, and constructing pie charts. These worksheets are useful for upper elementary and middle school students developing percentage, fraction, proportional reasoning, and data interpretation skills.
Bookmark Us Now!
New, high-quality worksheets are added every week! Do not miss out!