Interpreting Data Worksheets
About This Worksheet Collection
Interpreting data is where statistics becomes more than counting or calculating. Students must decide what a graph, table, survey, or numerical summary actually communicates and then use that information to answer questions, compare groups, recognize patterns, and evaluate conclusions. This collection develops those skills through increasingly sophisticated activities that move from straightforward graph reading to analysis of distributions, measures of center, variability, and evidence-based claims.
A wide range of data displays keeps the work varied and meaningful. Students investigate bar graphs, line graphs, frequency tables, dot plots, statistical summaries, surveys, and numerical collections while identifying maximums and minimums, calculating differences and totals, recognizing trends, comparing distributions, and interpreting mean, median, and range. Other worksheets focus specifically on determining whether statements are supported by the available evidence, correcting inaccurate claims, and recognizing when a conclusion cannot reasonably be made from the information provided.
Together, these activities encourage students to treat statistics as a process of reasoning from evidence rather than simply extracting numbers from a display. Learners practice distinguishing observation from assumption, considering both center and spread when comparing data sets, describing distribution features, and explaining why a conclusion is or is not justified. Those habits provide an important foundation for probability, scientific investigations, statistical reports, graph analysis, and the critical evaluation of numerical information encountered in everyday life.
Detailed Descriptions Of These Worksheets
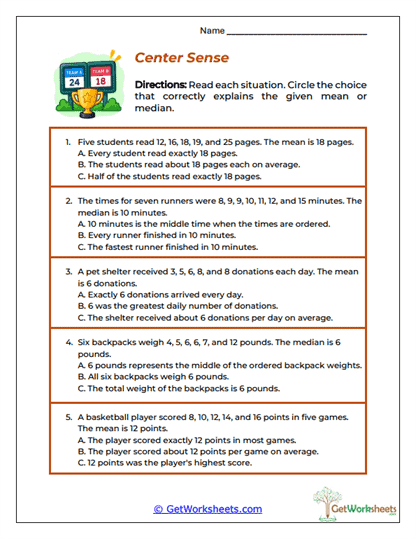
Center Sense
Rather than calculating averages repeatedly, students focus on what mean and median actually communicate about a data set. Real-world situations involving reading, running times, donations, weights, and basketball scores require learners to select the interpretation that correctly describes each statistical measure. Misleading answer choices expose common misconceptions, such as assuming the mean must be an observed value or that the median represents a total. The activity strengthens conceptual understanding of measures of center before students move into more complex distribution analysis.
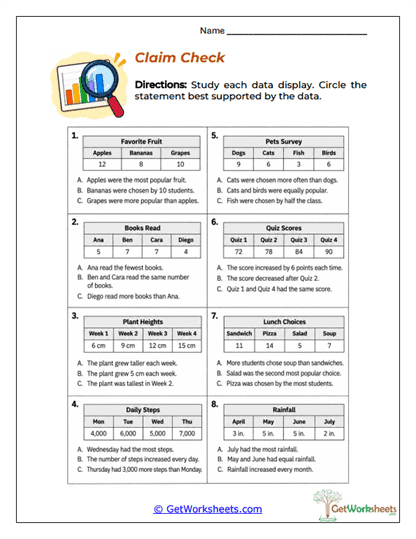
Claim Check
Eight different data displays challenge students to determine which conclusion is genuinely supported by the recorded information. Scenarios involving fruit preferences, books, plant growth, steps, pets, quiz scores, lunches, and rainfall require careful comparisons and pattern recognition. Students must distinguish what the numbers demonstrate from statements that merely sound reasonable. This emphasis on evidence develops a more critical approach to statistical claims.
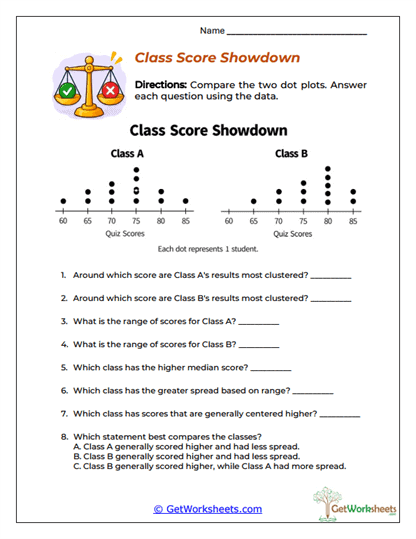
Class Score Showdown
Two dot plots representing separate classes provide the basis for a side-by-side comparison of quiz-score distributions. Students examine clusters, medians, ranges, spread, and overall performance rather than relying on a single high or low score. Questions encourage learners to consider both typical results and variability when deciding how the classes differ. The worksheet introduces the richer reasoning required when comparing entire distributions.
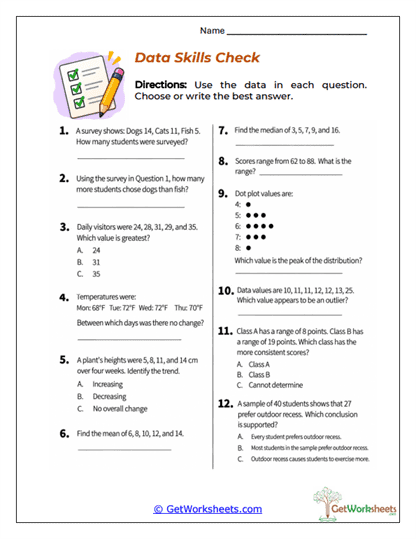
Data Skills Check
A broad review brings several statistical interpretation skills together in one activity. Students work with survey frequencies, mean, median, range, line-graph trends, dot plots, outliers, variability, and supported conclusions across twelve questions. Switching among short responses, calculations, and multiple-choice items requires learners to recognize which statistical idea applies in each situation. The format works particularly well for cumulative review or identifying areas that need additional instruction.
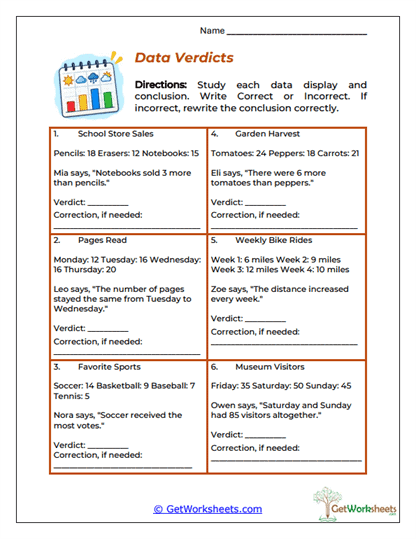
Data Verdicts
Everyday data scenarios are paired with statements that students must verify or reject. When a conclusion is incorrect, learners go a step further by rewriting it so that it accurately reflects the numerical evidence. Problems involve totals, differences, equal quantities, greatest values, and changes over time. Correcting the claims makes this activity especially valuable for developing precision in mathematical communication.
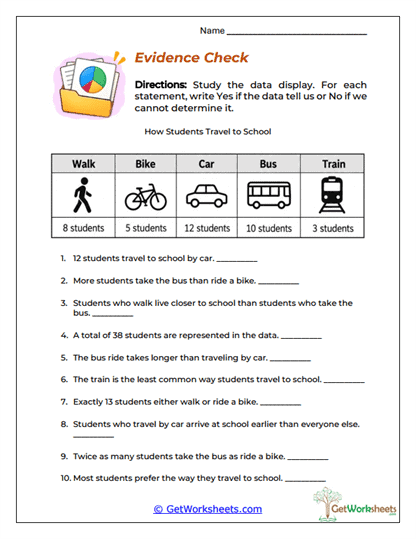
Evidence Check
A transportation table becomes the basis for deciding whether ten statements are supported, contradicted, or impossible to determine. Counts of students who walk, bike, ride in cars, use buses, or take trains can answer some questions, but they cannot reveal information such as travel time or distance. Students therefore learn that having data does not mean every related question can be answered from it. The three-way classification builds an important distinction between evidence, contradiction, and insufficient information.
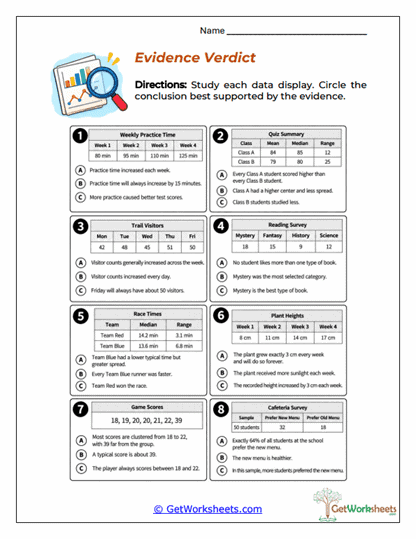
Evidence Verdict
Students evaluate conclusions drawn from several types of statistical information, including practice times, quiz summaries, trail visitors, reading surveys, race times, plant growth, game scores, and cafeteria preferences. Mean, median, range, trends, and variability may all provide evidence depending on the scenario. Some answer choices introduce assumptions or causal explanations that the data cannot establish. This worksheet pushes learners to consider not only what the numbers show, but also the limits of what can reasonably be concluded.
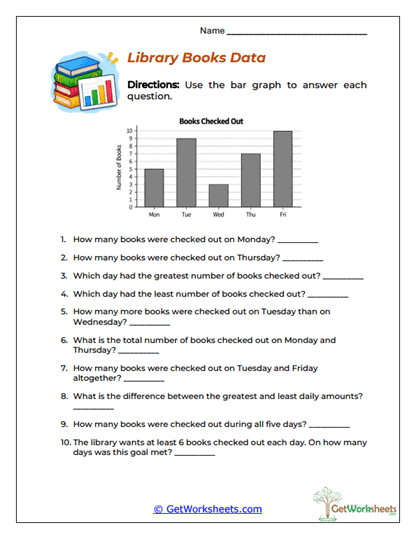
Library Books Data
A vertical bar graph displays library book checkouts across the school week. Students read daily values, identify the greatest and fewest checkouts, compare days, calculate differences, combine totals, and determine when specified goals were reached. Questions progress from direct graph reading into more involved numerical reasoning. The familiar library setting provides an accessible introduction to drawing conclusions from categorical data displays.
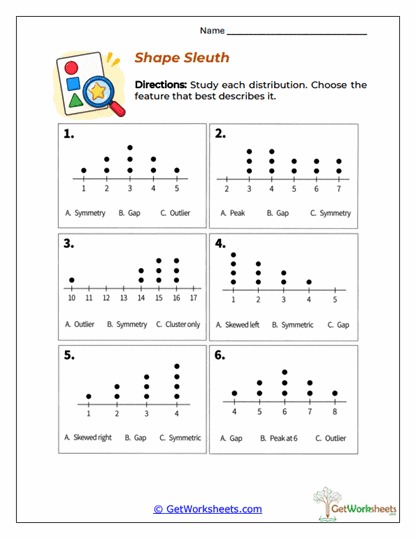
Shape Sleuth
Six dot plots invite students to identify defining features of numerical distributions. Symmetry, clusters, gaps, peaks, outliers, and left or right skew must be recognized from the arrangement of the plotted values. Because the work is primarily visual, students concentrate on the overall shape of a distribution instead of performing lengthy calculations. The activity builds statistical vocabulary and prepares learners to describe histograms and more complex data displays.
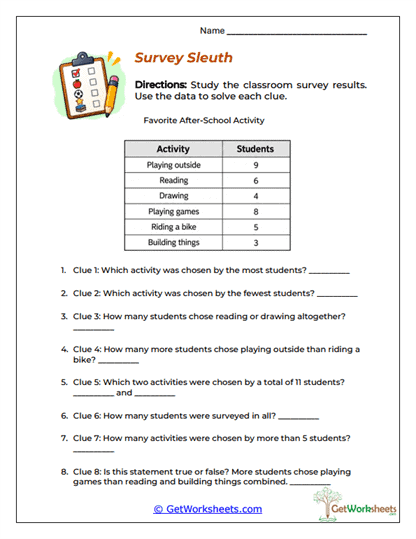
Survey Sleuth
A frequency table of favorite after-school activities becomes a set of eight numerical clues to solve. Students locate category frequencies, determine the most and least popular choices, combine counts, calculate differences, and test statements against the survey results. The clue-based format encourages learners to investigate rather than simply copy values from the table. It provides a useful blend of arithmetic, data interpretation, and logical reasoning.
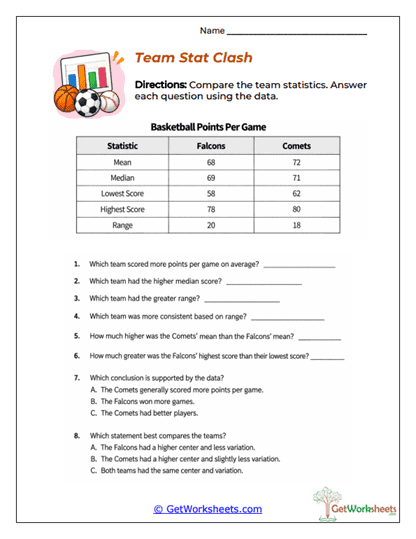
Team Stat Clash
Basketball statistics for two teams are compared using means, medians, lowest and highest scores, and ranges. Students calculate differences and decide what the summaries reveal about typical scoring and consistency. A higher measure of center and a smaller range communicate different aspects of performance, so learners must avoid treating one statistic as the whole story. This activity develops a more balanced understanding of center and spread.
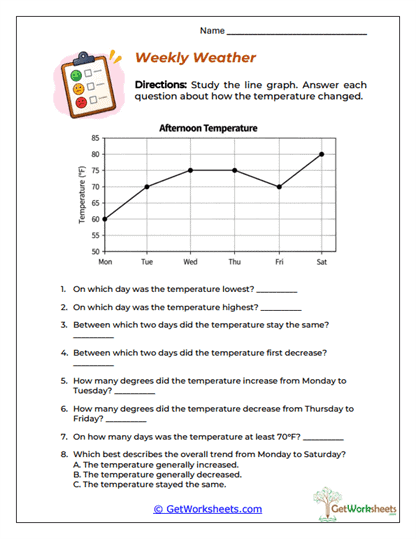
Weekly Weather
A line graph tracks afternoon temperatures from Monday through Saturday. Students identify individual readings, locate the highest and lowest temperatures, recognize repeated values, calculate changes, and describe whether the weather rises, falls, or remains steady across different intervals. Because the measurements occur in sequence, learners can see how connected points communicate change over time. The worksheet connects graph interpretation with measurement, subtraction, and introductory trend analysis.
Bookmark Us Now!
New, high-quality worksheets are added every week! Do not miss out!