Median, Mode, and Range Worksheets
About This Worksheet Collection
Median, mode, and range describe different features of a numerical data set, giving students more than one way to summarize what the numbers are doing. The median identifies the center once values are ordered, the mode highlights the value that appears most often, and the range measures the distance between the smallest and largest observations. This collection helps learners understand not only how to calculate each measure, but also why the procedures differ and what each result reveals about a distribution.
Practice begins with focused work on individual concepts before combining them in more demanding activities. Students order values to locate medians, average two middle numbers in even-sized data sets, count frequencies to identify modes, distinguish between one mode, multiple modes, and no mode, and calculate ranges from minimum and maximum values. Later worksheets integrate all three measures through matching, sports data, missing-value puzzles, error analysis, before-and-after comparisons, and cumulative review.
Working across these activities encourages students to look at data from several perspectives rather than expecting one statistic to tell the whole story. They learn that a change to one observation may affect the range without changing the median, that repeated values determine the mode, and that the median depends on position rather than frequency or size alone. These ideas prepare learners for comparing distributions, studying variability, interpreting graphs, examining outliers, and working with broader measures of center and spread.
Detailed Descriptions Of These Worksheets
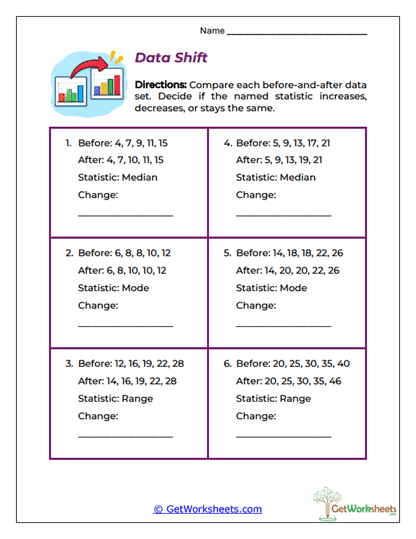
Data Shift
Paired data sets show students what happens to a statistical measure when one observation changes. Learners calculate the median, mode, or range before and after the modification and decide whether the result increased, decreased, or remained the same. The comparison makes it clear that altering a data value does not automatically affect every statistic. This activity develops a more flexible understanding of how individual observations influence an entire distribution.
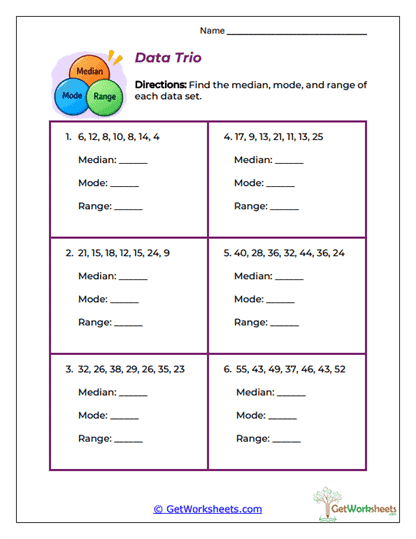
Data Trio
Each numerical collection is analyzed using median, mode, and range together. Students order values to locate the center, examine repetitions to find the mode, and subtract the minimum from the maximum to determine the spread. Keeping all three measures within the same problem helps learners distinguish their purposes instead of treating them as interchangeable procedures. The worksheet provides useful cumulative practice with center, frequency, and variability.
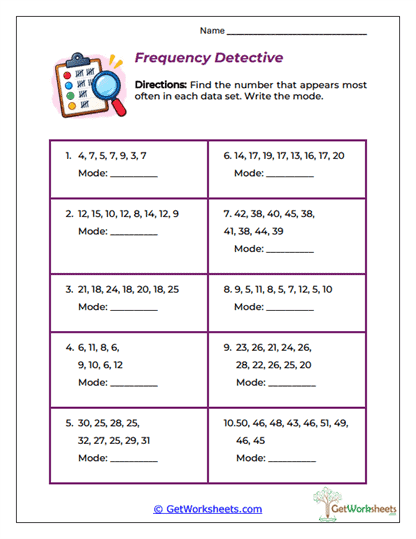
Frequency Detective
Repeated values become the focus as students search each data set for its mode. No lengthy arithmetic is required; instead, learners compare frequencies and identify which observation occurs most often. This makes the activity especially useful for connecting earlier frequency-table work with measures of central tendency. Careful counting also reinforces that the mode is not necessarily the largest or middle value.
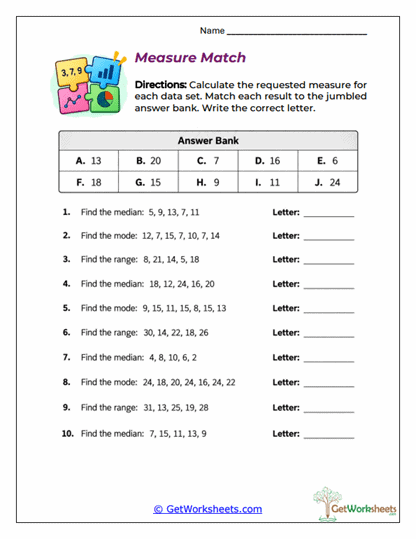
Measure Match
Median, mode, and range problems are mixed together and paired with a lettered answer bank. Before calculating, students must recognize which statistical measure each question requires and select the appropriate procedure. Matching the result to an available answer provides a natural opportunity to check for mistakes. The varied format strengthens both computational fluency and procedure selection.
Median Midpoint
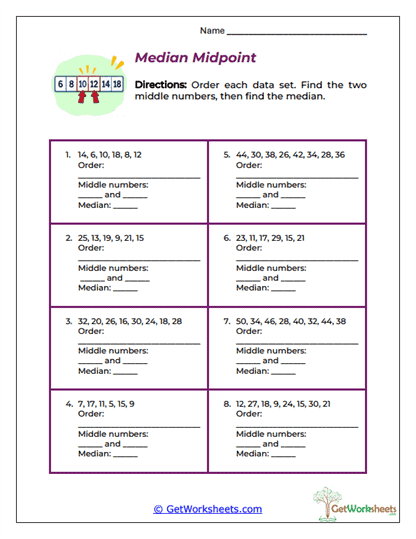
Even-numbered data sets require students to locate two middle observations rather than one. After ordering the numbers, learners add the central pair and divide by two to find the median. The process demonstrates why an even-sized data set can have a median that is not one of the original observations. This worksheet extends basic median work while reinforcing addition, division, and accurate ordering.
Middle Value Hunt
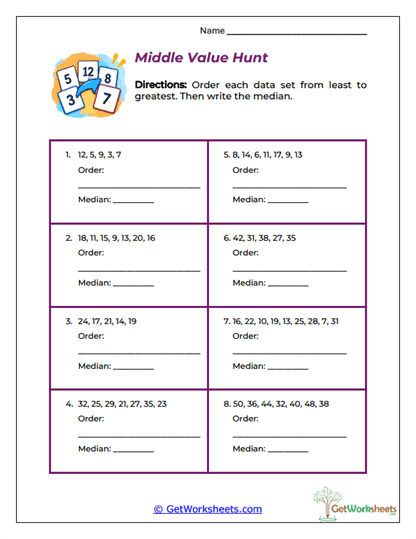
Unordered data sets are arranged from least to greatest before students identify the central observation. Requiring the ordered list to be written first emphasizes that position determines the median. The exercises use odd numbers of values so learners can focus on finding one clear middle point. This introductory structure builds reliable habits for more advanced median calculations.
Mode Sort
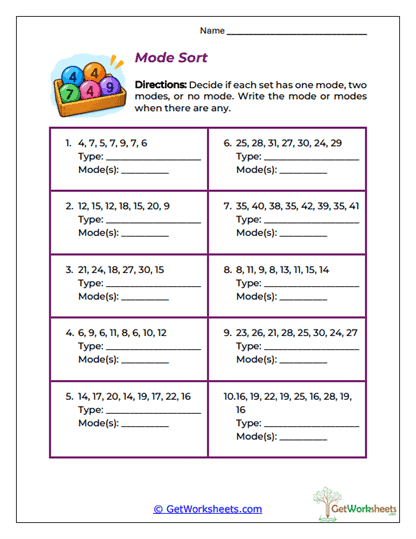
Students determine whether each data set has one mode, two modes, or no mode at all. They compare the frequencies of repeated values and record both the classification and any mode values that exist. This prevents the common assumption that every data set must have exactly one mode. The activity broadens students' understanding of frequency patterns and introduces bimodal distributions.
Range Check
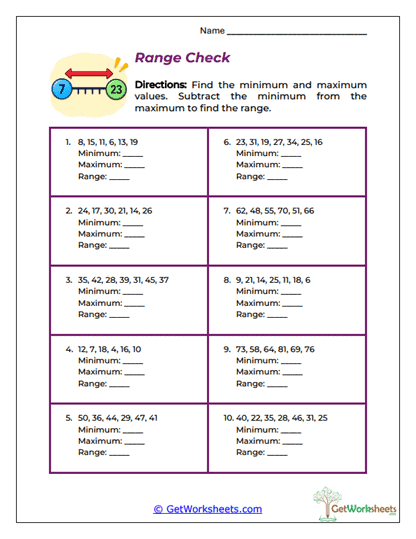
Each problem asks learners to identify the minimum, maximum, and range of a numerical collection. Finding both extremes before subtracting provides a clear routine for measuring the spread between the endpoints. The worksheet also reinforces that range describes variability rather than the center or most common value. Repeated practice strengthens numerical comparison and subtraction accuracy.
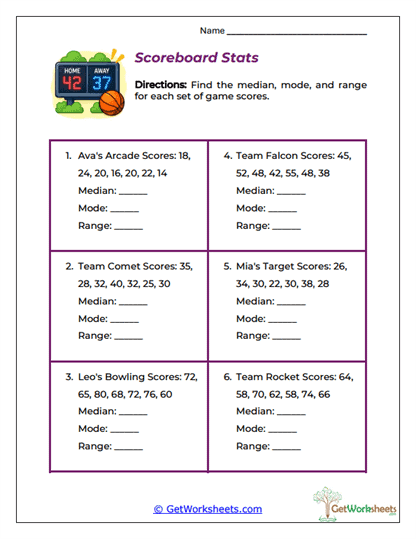
Scoreboard Stats
Sports and game scores provide a practical setting for calculating median, mode, and range. Students organize results, identify middle and repeated values, and compare the highest and lowest scores within each collection. Using all three measures shows how the same performance data can be summarized in different ways. The familiar contexts also make it easier to discuss consistency, typical results, and repeated performances.
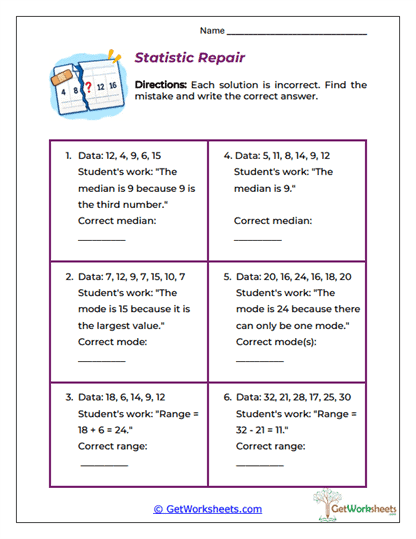
Statistic Repair
Examples of incorrect student work require learners to inspect median, mode, and range calculations carefully. They identify mistakes such as using unsorted values, overlooking repeated frequencies, or subtracting the wrong numbers when finding range. After locating the error, students determine the correct statistical result. This error-analysis approach strengthens conceptual understanding and encourages more careful self-checking.
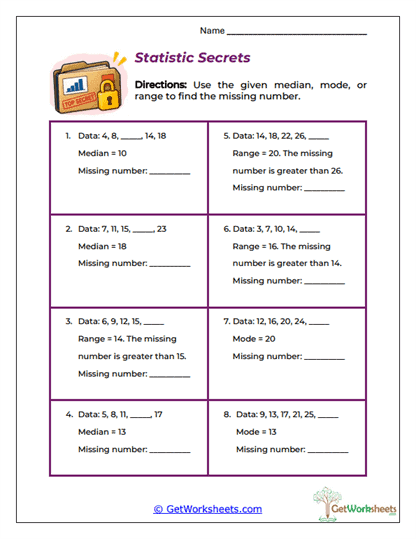
Statistic Secrets
Missing values must be determined from a stated median, mode, or range. Depending on the problem, students may need to reason about middle positions, create the correct repeated value, or work backward from a known spread. The unknown cannot be found by applying one routine to every question, so learners must first decide which statistical condition controls the solution. This makes the worksheet a strong bridge between statistics and early algebraic reasoning.
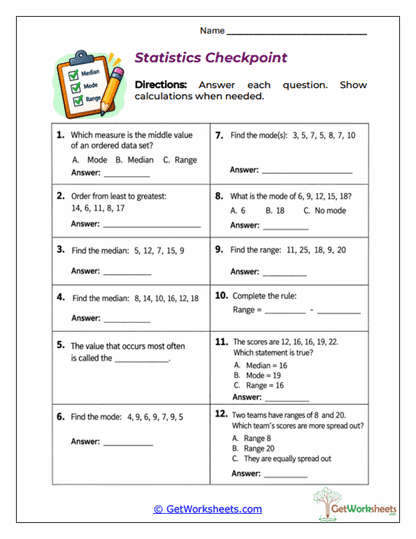
Statistics Checkpoint
A mixed review assesses understanding of median, mode, and range through several question types. Students order data, identify middle values, analyze repetitions, calculate ranges, interpret vocabulary, and compare statistical results across different data sets. Multiple-choice and short-response formats require both recognition and independent calculation. The worksheet works well as a final review or diagnostic check before moving into more advanced statistics.
Bookmark Us Now!
New, high-quality worksheets are added every week! Do not miss out!