Bar Graphs Worksheets
About This Worksheet Collection
Bar graphs help students organize numbers visually so they can compare categories, identify patterns, and answer questions about data more quickly. Learners practice reading bar heights, interpreting scales, comparing values, finding differences, combining categories, and understanding how graph parts work together. These skills support data literacy, number sense, addition, subtraction, and mathematical reasoning.
This collection gives students several ways to practice both reading and creating bar graphs. Activities include interpreting completed graphs, transferring data lists into bars, identifying graph components, completing missing bars, reading scaled axes, checking graph errors, choosing appropriate scales, solving for missing values, and answering multi-step questions from graph data. The worksheets are well suited for grades 2-5 and can be used for classroom lessons, centers, independent practice, homework, review, tutoring, or homeschool instruction.
As students work through the collection, they strengthen graph construction, scale reading, category comparison, data interpretation, addition, subtraction, and problem solving. They also practice using totals, identifying missing information, checking graphs for accuracy, choosing efficient intervals, and explaining what the data shows. These activities help learners move from simply looking at bars to confidently using graphs as mathematical tools.
Detailed Descriptions Of These Worksheets
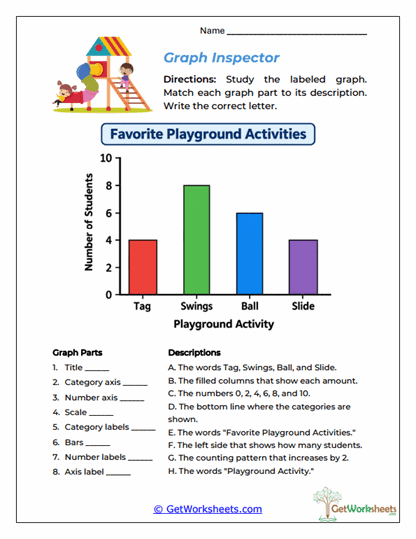
Bar Graph Parts Inspector
Students examine a completed bar graph and identify important features such as the title, category axis, number axis, scale, labels, and bars. Matching each part with its purpose helps learners understand how a graph communicates information. The activity also reinforces the difference between categorical and numerical information. This worksheet builds the vocabulary students need to read and create graphs accurately.
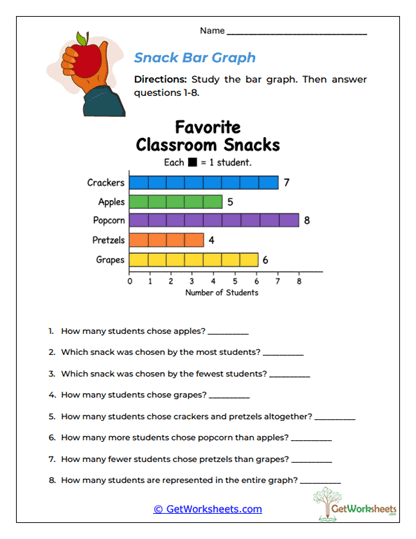
Classroom Snack Survey
Students interpret a bar graph showing favorite classroom snacks and answer questions about exact values, most and least popular choices, differences, combined totals, and the overall number represented. The activity requires learners to use graph data for several types of calculations instead of only spotting the tallest bar. Comparing bar heights helps make numerical differences more visible. This worksheet strengthens graph interpretation and basic operations at the same time.
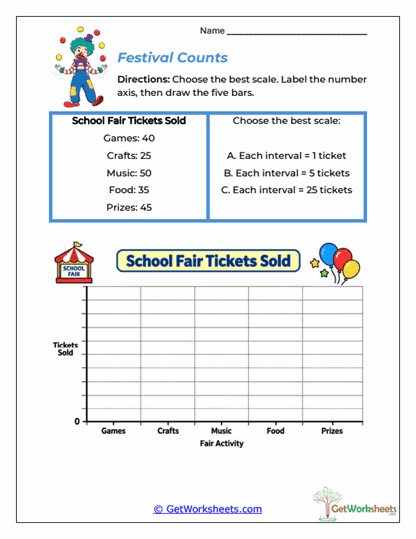
Fair Scale Builder
Students examine school-fair data, choose an appropriate scale, label the numerical axis, and construct the corresponding bars. Selecting the interval themselves helps learners understand why graph scales must fit the size of the data. The activity combines skip counting with careful graph construction. It encourages students to create displays that are accurate, efficient, and easy to read.
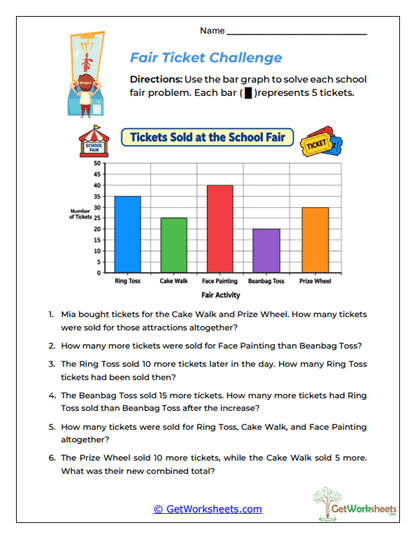
Fair Ticket Analysis
A completed school-fair graph provides data for multi-step questions involving totals, differences, increases, and updated values. Students identify the correct bars before deciding whether to add, subtract, or change a value. This pushes graph work beyond simple reading and into deeper problem solving. The activity strengthens data analysis and careful interpretation of mathematical language.
Fruit Bars
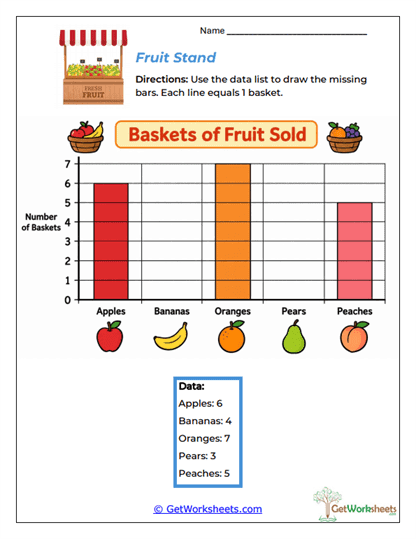
Students use a fruit-sales data list to complete missing portions of a partially finished bar graph. Existing bars provide examples while learners draw the remaining categories to the correct heights. The activity requires students to compare the data table with the graph and use the scale consistently. It is useful for building confidence before students create an entire graph independently.
Graph Error Detective
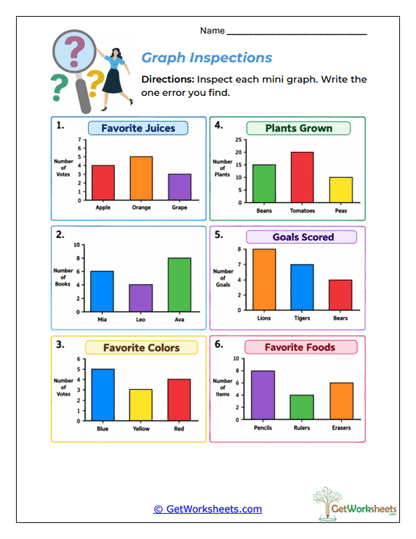
Students inspect several bar graphs for mistakes involving scales, labels, bar heights, numbers, or category placement. Rather than assuming the graph is correct, learners use the data and graph structure to explain what is wrong. This encourages careful visual reasoning and strengthens understanding of how graph components interact. The worksheet also builds valuable error-checking habits.
Missing Bar Mystery
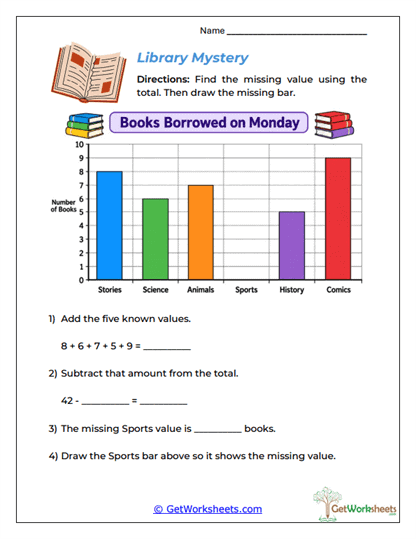
A graph contains one missing category value, but the total for all categories is provided. Students add the known bar values, subtract that amount from the overall total, and use the result to draw the missing bar. The task combines graph interpretation with part-to-whole reasoning. This activity gives students more advanced practice using data relationships rather than simply reading a value directly.
Park Pet Data Builder
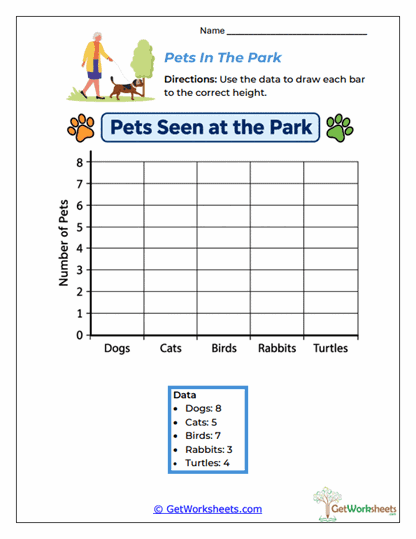
Students receive a list of pet counts and create a bar graph that represents the data. Each category must be matched with the correct label and bar height on the scale. Building the graph from raw values helps learners understand how numerical information becomes a visual display. This worksheet strengthens data transfer, axis reading, and graph-construction accuracy.
Pet Survey
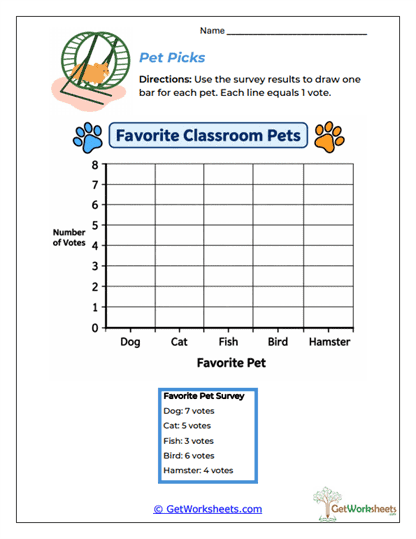
Survey results for several pets are turned into a complete bar graph. Students draw one bar for each category and make sure its height matches the corresponding vote total. The straightforward format provides hands-on practice with graph construction and category matching. It also helps learners see how survey data can be organized for quick visual comparison.
Reading Scale Challenge
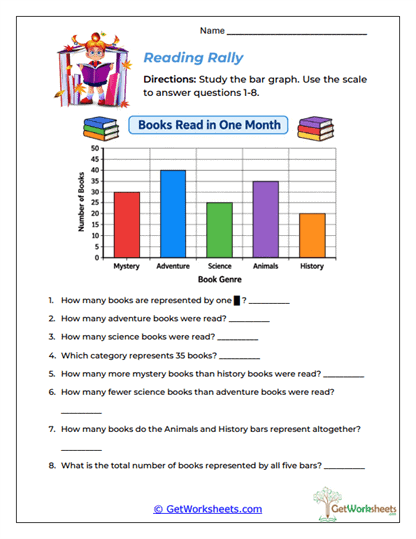
Students interpret a graph whose axis increases by intervals larger than one. They first determine what each interval represents and then answer questions about category values, differences, combined totals, and overall amounts. This reinforces the importance of reading the scale before interpreting the bars. The activity strengthens skip counting and prepares learners for more advanced scaled graphs.
Recess Comparison
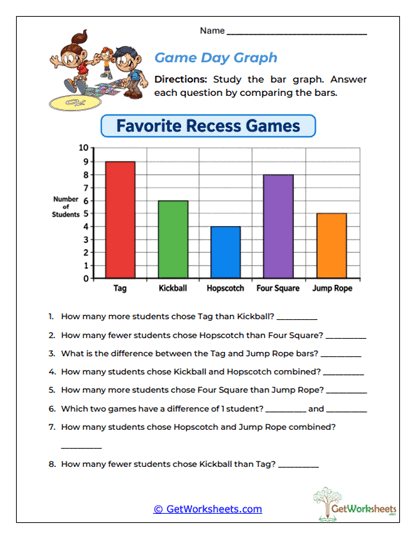
A completed graph of favorite recess activities is used to answer comparison questions. Students identify exact values, calculate how many more or fewer, combine categories, and begin working with multiplicative comparisons such as twice as many. The activity gives addition and subtraction a meaningful data context. It also develops stronger understanding of comparison language.
Snack Stand Data Builder
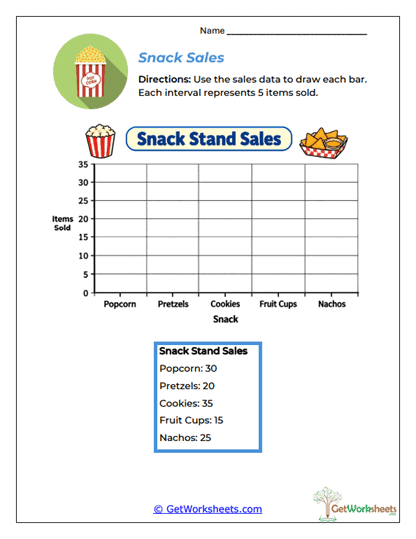
Students construct a bar graph from snack-sales data using a scale that increases by five. They must count by fives, match each category with its value, and draw bars to the correct heights. The scaled-axis format makes the activity more challenging than a graph that counts by ones. This worksheet combines graph construction with skip-counting fluency.
Bookmark Us Now!
New, high-quality worksheets are added every week! Do not miss out!