Line Graphs Worksheets
About This Worksheet Collection
Line graphs help students understand how data changes over time and how two values can be connected through plotted points. Learners practice reading axes, scales, data points, increases, decreases, constant values, and overall trends while connecting visual patterns to numerical information. These skills support data interpretation, measurement, comparison, subtraction, and early rate-of-change reasoning.
This collection gives students several ways to practice both reading and creating line graphs. Activities include identifying graph parts, reading temperatures, plotting data from tables, completing unfinished graphs, choosing scales, recognizing trends, measuring increases and decreases, analyzing visitor patterns, checking graph errors, comparing weather changes, working with double line graphs, and reviewing mixed line-graph concepts. The worksheets are well suited for grades 4-5 and can be used for classroom lessons, centers, independent practice, homework, tutoring, intervention, or homeschool instruction.
As students work through the collection, they strengthen graph vocabulary, scale reading, data plotting, comparison, trend analysis, and mathematical reasoning. They also practice identifying maximum and minimum values, calculating changes between data points, interpreting flat or rising lines, comparing multiple data sets, and checking whether a graph has been built accurately. These activities help learners move from simply locating points to confidently explaining what a line graph shows and how the data changes over time.
Detailed Descriptions Of These Worksheets
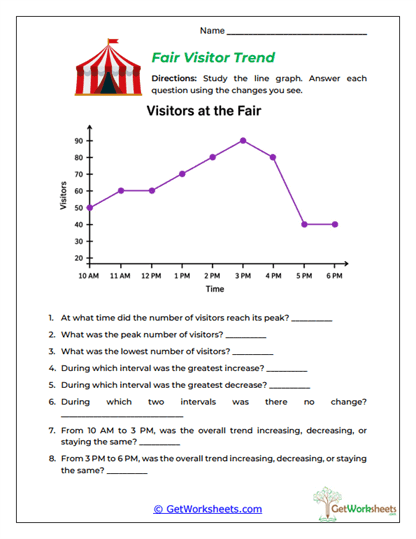
Fair Visitor Trend
Students analyze a line graph showing how visitor numbers change throughout the day. They identify the highest and lowest values, locate the greatest increase and decrease, recognize periods of no change, and describe broader trends. The activity helps learners move beyond individual points and consider what the graph communicates as a whole. It strengthens comparison, trend vocabulary, and data reasoning.
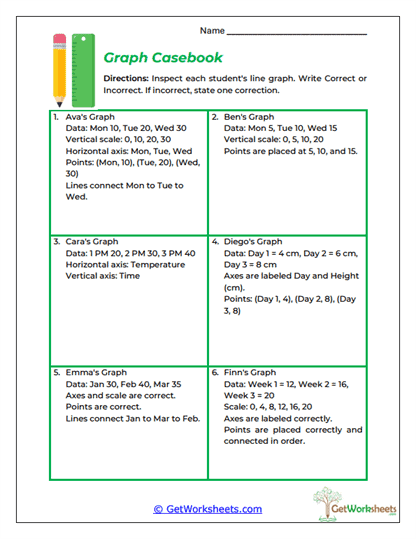
Graph Casebook
Students review descriptions of completed line graphs and decide whether each setup is accurate. They inspect scales, labels, data points, axes, and connecting lines to find mistakes and explain how they should be corrected. The error-analysis format encourages students to apply several graphing rules at once. This worksheet strengthens graph construction knowledge and careful self-checking habits.
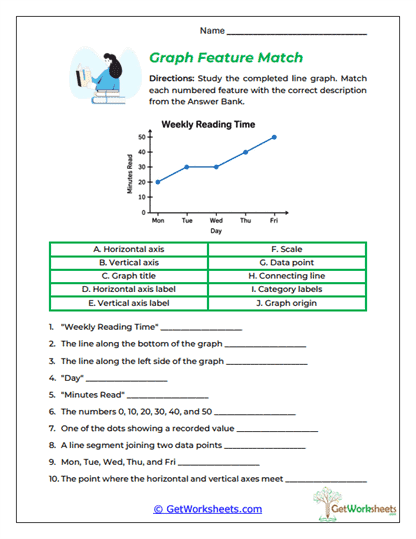
Graph Feature Match
A completed line graph is used to introduce important features such as the title, horizontal axis, vertical axis, scale, labels, data points, and connecting line. Students match each feature with the correct mathematical term. Understanding these parts gives learners a stronger foundation for later interpretation and graph construction. The activity is especially useful before students begin working with more complex line-graph questions.
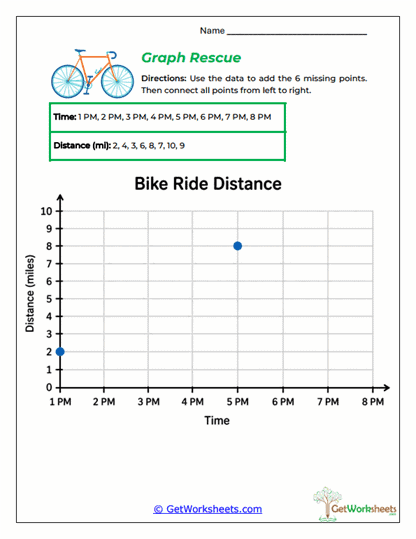
Graph Rescue
Students use a data table to complete an unfinished line graph about a bike ride. Existing points provide a model while learners plot the remaining time-and-distance values and connect them in order. The activity bridges the gap between reading a finished graph and creating one independently. It reinforces data transfer, scale use, and chronological graphing.
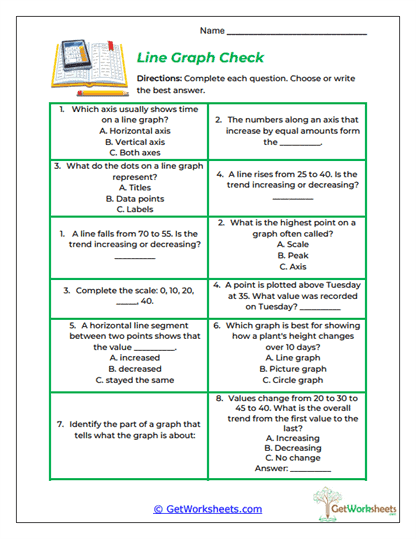
Line Graph Check
Mixed questions provide a broad review of line-graph vocabulary and interpretation. Students work with axes, scales, data points, trends, horizontal sections, high values, and change over time. Because the question types vary, learners must decide which graphing idea applies rather than repeat one procedure. This worksheet is useful for review, assessment, and identifying areas that need additional practice.
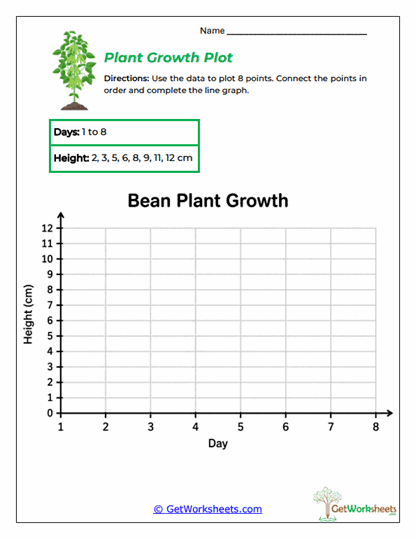
Plant Growth Plot
Students take a set of plant-height measurements and create a line graph showing growth across several days. They plot each data point accurately and connect the values in chronological order. Transforming a table into a graph helps learners see how numerical information becomes a visual pattern. The activity also provides a useful connection between mathematics and science data.
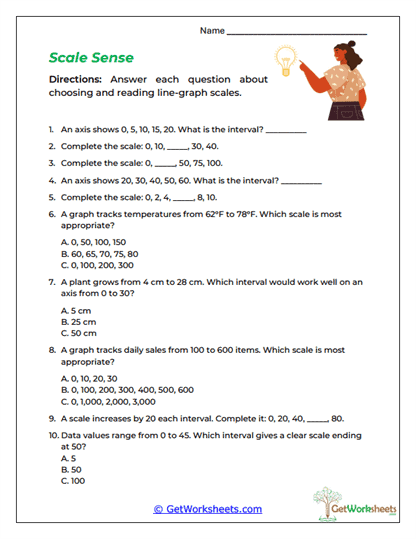
Scale Sense
Students focus on how numerical intervals are organized along graph axes. They complete missing scale values, identify intervals, and choose appropriate scales for different sets of data. The activity reinforces skip counting and number patterns while showing why a graph's scale must fit the size of the data. Strong scale understanding helps students both read and create graphs more accurately.
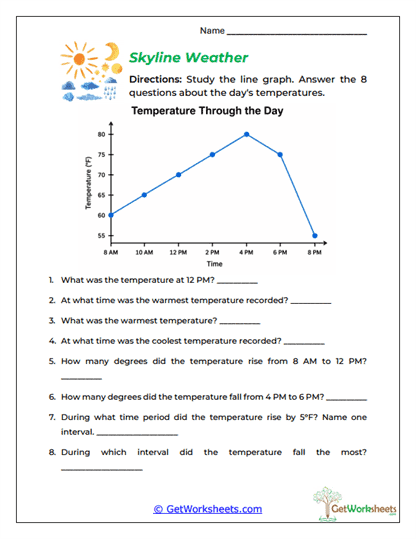
Skyline Weather
Students read a temperature line graph and answer questions about exact values, warmest and coolest readings, increases, decreases, and the largest changes between time intervals. The familiar weather context makes trend analysis easier to visualize. Learners combine graph reading with subtraction and comparison. This worksheet strengthens both arithmetic and data interpretation.
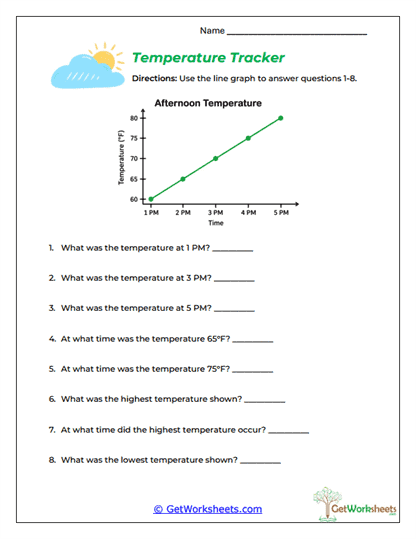
Temperature Tracker
A line graph showing afternoon temperatures provides focused practice locating exact data points. Students match times with temperatures and identify the highest and lowest values displayed. The activity reinforces the relationship between the horizontal and vertical axes. It provides a clear introduction to reading line-graph values accurately.
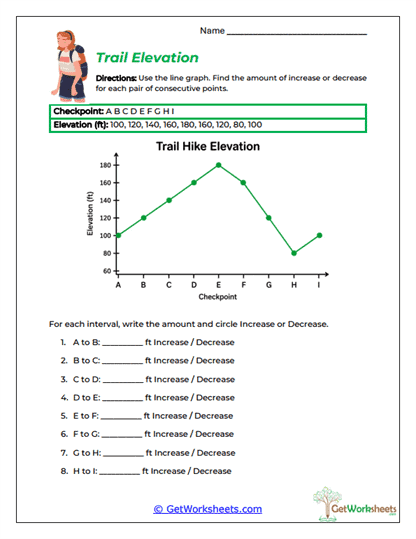
Trail Elevation
Students compare consecutive elevation points along a trail and calculate how much the value rises or falls. They must identify both the amount of change and whether that change represents an increase or decrease. The activity combines graph interpretation with subtraction in a realistic measurement context. It prepares learners for deeper work with rate and change.
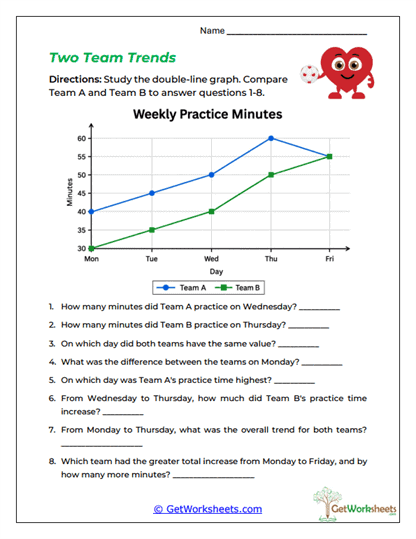
Two Team Trends
Two data sets are displayed on the same line graph so students can compare Team A and Team B. Learners use the graph key, identify exact values, find equal points and differences, and describe how the two trends change across time. Tracking two lines at once builds more advanced graph-reading skills. The activity strengthens comparison, legend use, and multi-data-set reasoning.
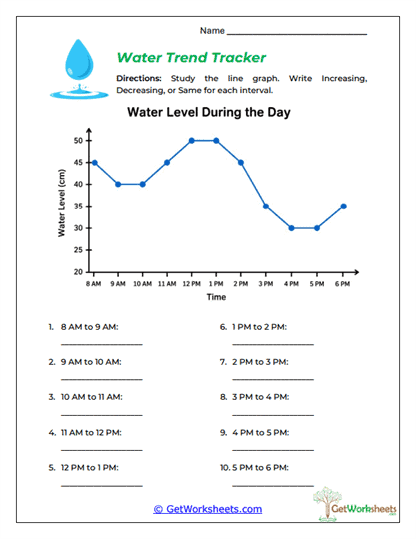
Water Trend Tracker
Students examine a water-level graph and classify each interval as increasing, decreasing, or staying the same. Rather than focusing on exact numbers alone, learners pay attention to the direction and shape of the line. Flat, rising, and falling sections make trend vocabulary easy to connect with visual evidence. This activity builds a strong foundation for later work with rates of change and scientific graphs.
Bookmark Us Now!
New, high-quality worksheets are added every week! Do not miss out!