Line of Best Fit Worksheets
About This Worksheet Collection
Lines of best fit help students summarize the overall pattern in a scatter plot and use that pattern to make predictions. Learners begin by recognizing positive, negative, or weak correlation, then move toward drawing reasonable trend lines, comparing slope and steepness, writing linear equations, and interpreting what those equations mean. These skills connect data analysis, graphing, algebra, prediction, and statistical reasoning.
This collection gives middle school students several ways to practice working with scatter plots and best-fit models. Activities include identifying correlation, drawing and evaluating trend lines, choosing reasonable models, making predictions, writing equations from graphs, interpreting slope in context, distinguishing interpolation from extrapolation, analyzing outliers, matching graphs with equations, and building a complete model from raw data. The worksheets are well suited for middle school graphing, algebra, statistics, independent practice, tutoring, intervention, review, or homeschool instruction.
As students work through the collection, they strengthen scatter plot interpretation, slope reasoning, linear modeling, equation writing, estimation, and prediction. They also practice judging model quality, recognizing the influence of outliers, connecting graph features to algebraic equations, and deciding whether a prediction is supported by the original data range. These activities help learners move from simply noticing a trend to using mathematical models to describe and interpret real-world relationships.
Detailed Descriptions Of These Worksheets
Best Line Pick
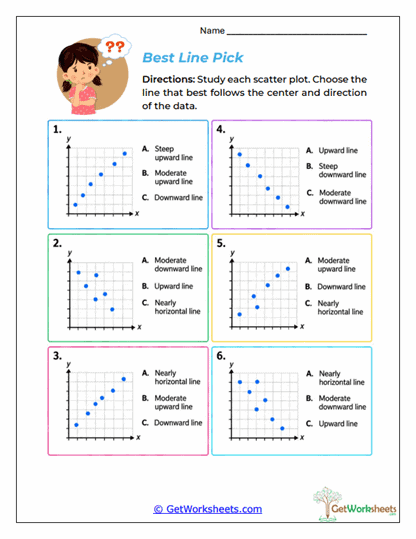
Students examine scatter plots and choose the type of line that best matches each data set. They consider whether the trend is upward, downward, or nearly horizontal and whether the line should be steep or gradual. The activity helps learners connect visual patterns with slope direction and relative steepness. It provides useful preparation for estimating numerical slopes and writing equations.
Check the Trends
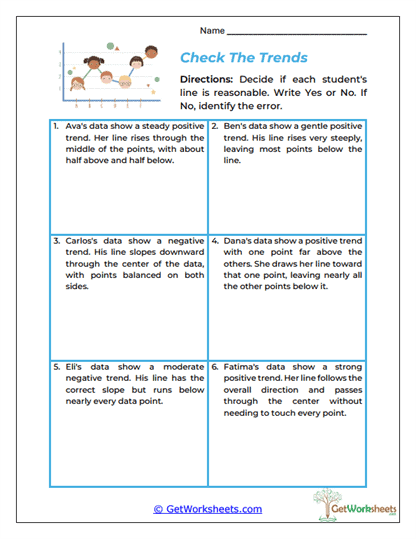
Students evaluate proposed lines of best fit and decide whether each one reasonably represents the data. They consider slope, trend direction, data balance, center, and outliers when judging the model. Incorrect approaches must be explained and corrected. This activity strengthens model evaluation and error-analysis skills.
Cool Drink Forecast
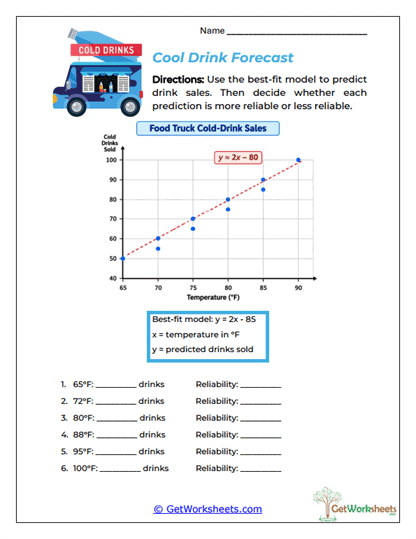
A scatter plot relating temperature and cold drink sales is paired with a best-fit equation. Students substitute temperatures into the model, calculate predicted sales, and judge how reliable each prediction is based on the data range. The activity connects scatter plots, equations, interpolation, and extrapolation in a practical setting. It also reinforces the idea that predictions farther outside the observed range may be less dependable.
Fit Equation Lab
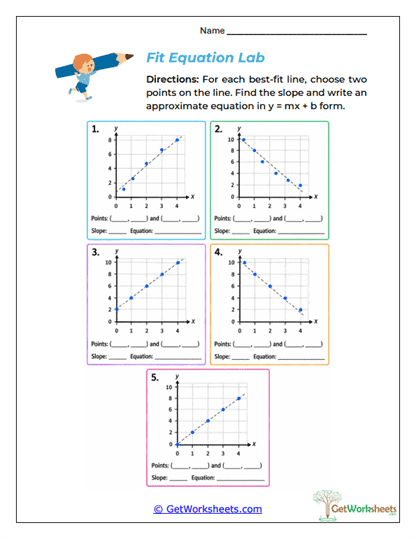
Students turn drawn best-fit lines into approximate linear equations. They choose convenient points on each line, estimate slope, identify the y-intercept, and write the model in slope-intercept form. The activity creates a clear bridge between visual graphing and algebra. It strengthens rise-over-run reasoning and graph-to-equation fluency.
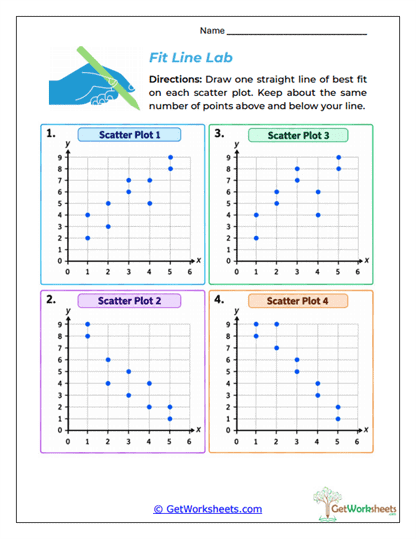
Fit Line Lab
Several scatter plots give students hands-on practice drawing reasonable lines of best fit. Learners try to follow the overall trend and keep a balanced number of points above and below the line. The activity emphasizes that a best-fit line should summarize the data rather than connect individual points. This worksheet builds visual modeling and estimation skills.
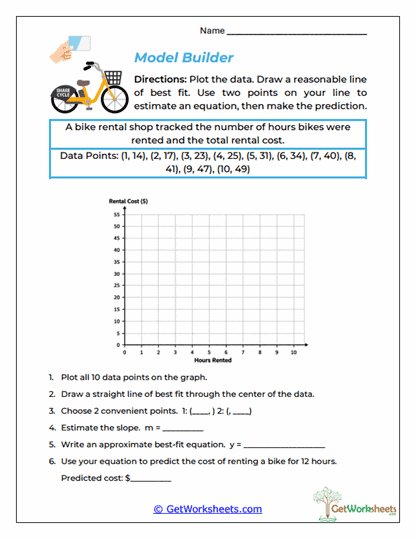
Model Builder
Students complete the entire modeling process using a real-world bike-rental data set. They plot the points, draw a best-fit line, estimate slope, write an equation, and use the model to make a prediction. The connected sequence shows how raw data can become a graph, then an algebraic model, and finally a useful forecast. This activity provides strong cumulative practice with line-of-best-fit concepts.
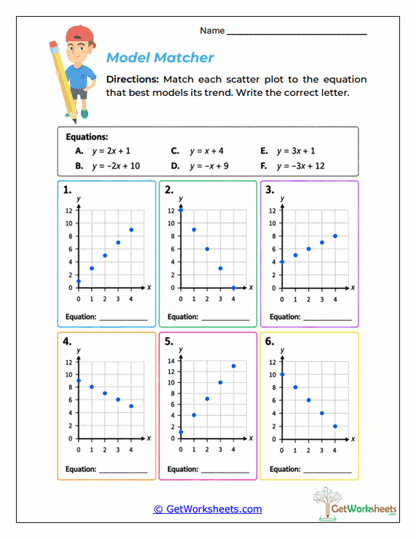
Model Matcher
Scatter plots are matched with the linear equations that best represent their trends. Students compare slope sign, steepness, and approximate intercept to determine which model fits each graph. The activity helps learners connect symbolic equations with visible graph features. It strengthens algebraic interpretation and model comparison.
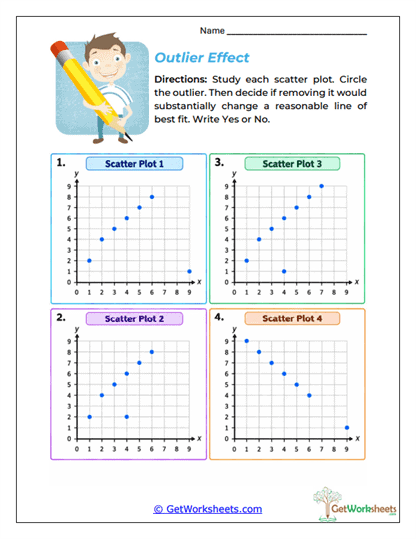
Outlier Effect
Students identify unusual points in scatter plots and consider how strongly those outliers influence the line of best fit. They compare the overall trend with and without the unusual value in mind. The activity shows that some outliers substantially affect a model while others have little influence. It builds statistical reasoning and more careful interpretation of data sets.
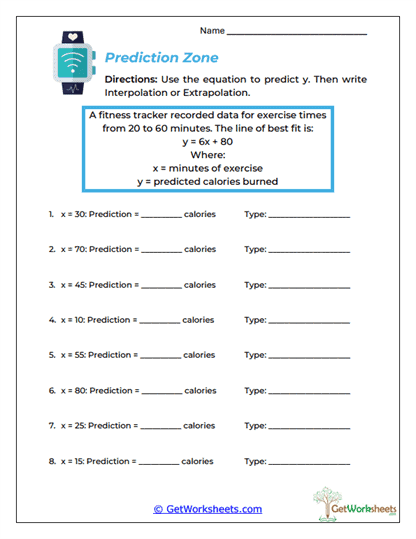
Prediction Zone
Students use a linear best-fit equation to calculate predicted values and then classify each prediction as interpolation or extrapolation. The original data range provides the basis for deciding which type of prediction was made. This activity combines substitution with statistical interpretation. It also introduces the idea that predictions within the observed range are generally more closely supported by the data.
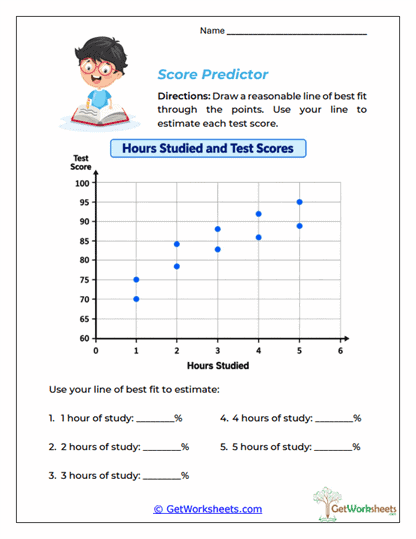
Score Predictor
A scatter plot showing study time and test scores is used to create a line of best fit and estimate unknown values. Students draw a reasonable model and use it to predict scores at selected study times. The familiar context makes predictive modeling easier to understand. This worksheet strengthens positive-correlation reasoning, estimation, and graph-based prediction.
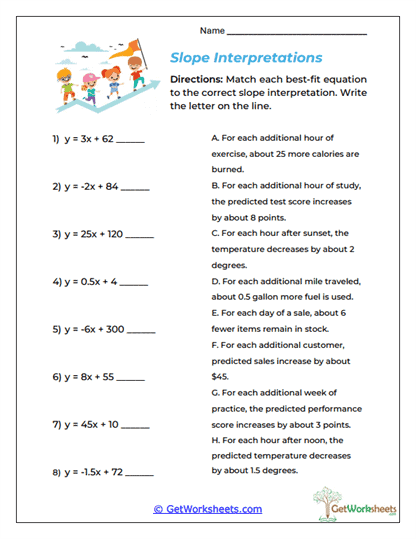
Slope Interpretations
Students match slope-intercept equations with real-world descriptions of how one quantity changes as another increases. Situations involving exercise, travel, temperature, sales, practice, and inventory help make slope meaningful. Learners distinguish positive from negative rates and explain the amount of change per unit. This activity strengthens contextual understanding of slope and rate of change.
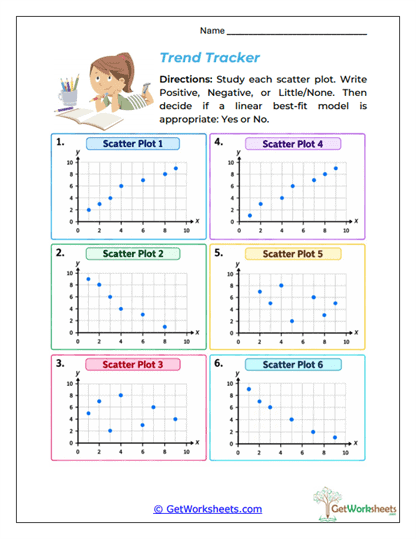
Trend Tracker
Students analyze scatter plots and classify each relationship as positive correlation, negative correlation, or little to no correlation. They also decide whether a straight line of best fit would reasonably represent the data. The activity encourages learners to focus on the overall distribution rather than isolated points. It provides an important foundation for later work with prediction, slope, and regression.
Bookmark Us Now!
New, high-quality worksheets are added every week! Do not miss out!