Picture Graphs Worksheets
About This Worksheet Collection
Picture graphs help students organize and understand data by using symbols to represent amounts. Learners begin by identifying graph parts such as titles, categories, symbols, and keys, then build toward counting data, comparing categories, using scaled symbols, completing graphs, and interpreting partial pictures. These skills support counting, skip counting, addition, subtraction, early multiplication, fractions, and data literacy.
This collection gives students several ways to practice reading and creating pictographs. Activities include identifying picture graph features, counting symbols, interpreting scaled keys, completing missing rows, building full pictographs from data, comparing category totals, matching data sets to graphs, checking graph errors, working with half symbols, and reviewing mixed pictograph skills. The worksheets are well suited for grades 2-3 and can be used for classroom lessons, math centers, independent practice, homework, tutoring, intervention, or homeschool instruction.
As students work through the collection, they strengthen graph vocabulary, symbol counting, key interpretation, category comparison, data representation, and arithmetic reasoning. They also practice using repeated groups, finding totals and differences, translating numerical data into pictures, and deciding whether a graph accurately matches the information provided. These activities help learners move from simple symbol counting to confident use of scaled pictographs and more advanced visual data displays.
Detailed Descriptions Of These Worksheets
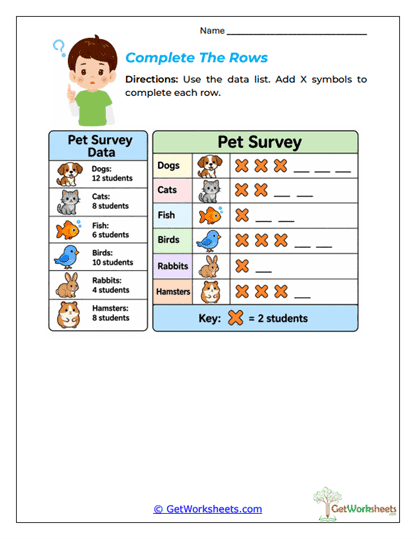
Complete the Rows
Students use pet survey totals to finish an incomplete picture graph. A key shows that each symbol represents two students, so learners must determine how many pictures belong in each row rather than drawing one symbol per vote. The activity connects numerical data with visual representation while reinforcing counting by twos. It provides useful practice with scaled pictograph construction.
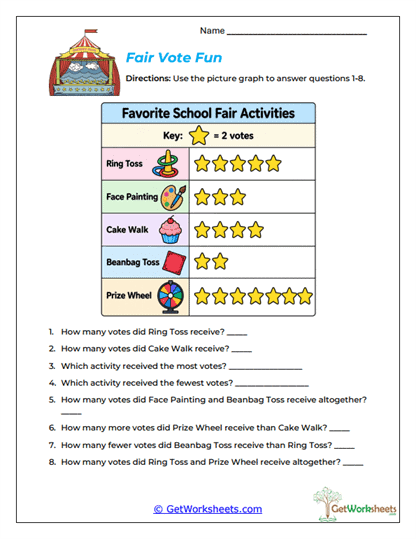
Fair Vote Fun
A school-fair pictograph is used to answer questions about activity preferences. Students apply a key in which each star represents two votes, then identify totals, compare categories, calculate differences, and combine values. The activity blends graph interpretation with addition, subtraction, and early multiplication ideas. It helps learners understand that pictograph symbols often represent groups rather than single items.
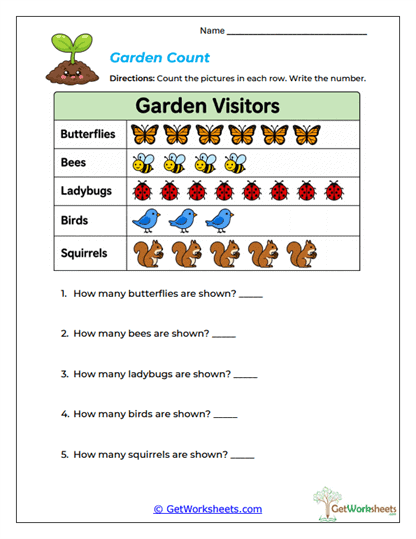
Garden Count
Students count the symbols shown for butterflies, bees, ladybugs, birds, and squirrels and record each category total. The simple one-picture-per-item format gives beginning learners an accessible introduction to picture graph reading. Students practice organized counting and matching data to the correct category. This worksheet builds early confidence with graphs and visual data.
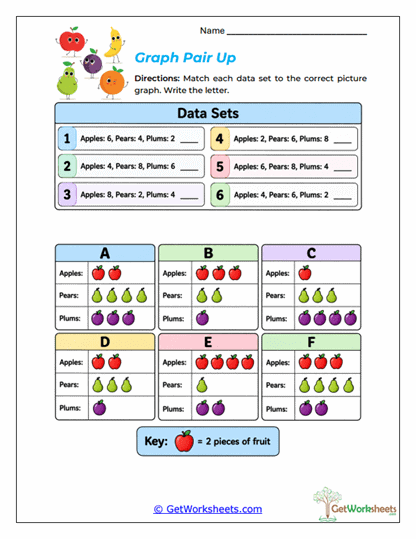
Graph Pair Up
Students match numerical fruit data sets with the pictographs that correctly represent them. A key showing that each symbol equals two pieces of fruit requires learners to translate between numbers and scaled pictures. Every category must match before a graph can be selected. The activity strengthens data comparison, visual reasoning, and attention to detail.
Half Picture Count
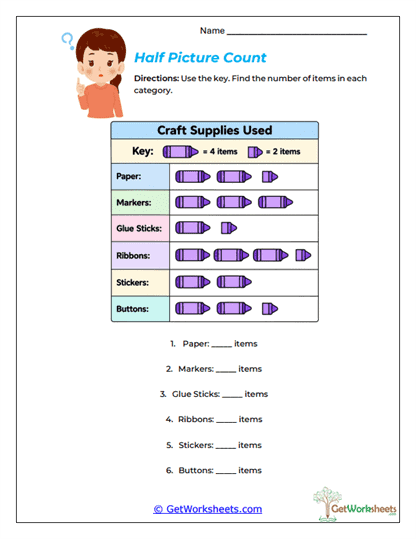
Whole and half symbols are used to represent craft-supply data. Students determine the value of a complete symbol, find the value of a half symbol, and combine the amounts to calculate each category total. The activity connects pictographs with early fraction concepts in a visual way. It prepares learners for more advanced scaled graphs that use partial symbols.
Pictograph Mastery
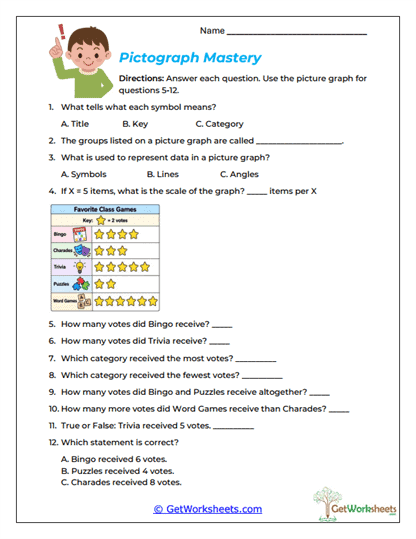
A mixed review checks understanding of titles, keys, categories, symbols, scales, totals, and comparisons. Students switch among vocabulary, counting, interpretation, and arithmetic questions instead of repeating one type of task. This makes the worksheet useful for reviewing the topic as a whole. It can also help identify which pictograph skills need additional practice.
Picture Graph Inspector
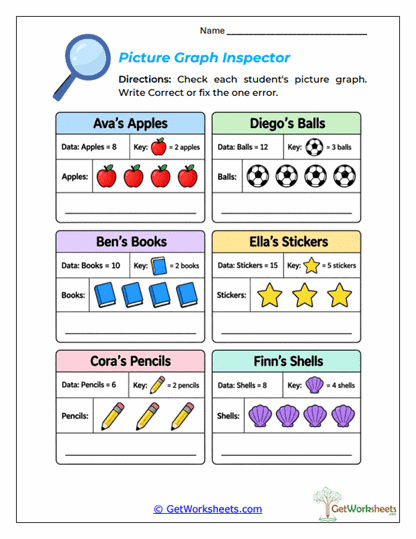
Students examine picture graphs for mistakes and decide whether each display correctly represents the stated data. They compare totals with the graph key and number of symbols shown, then explain how incorrect graphs should be fixed. Different symbol values require careful use of multiplication and equal-group reasoning. The error-analysis format encourages learners to check graphs rather than automatically trust them.
Picture Graph Parts
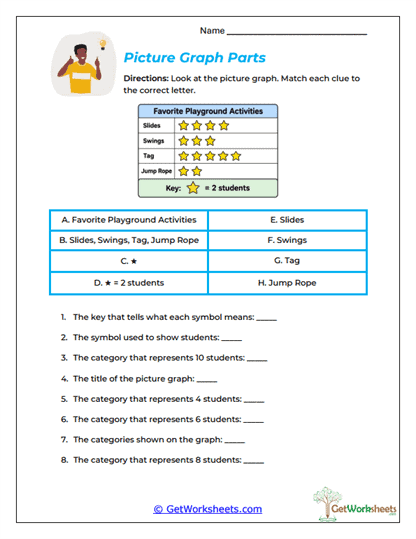
Students identify important pictograph features such as the title, categories, symbols, key, and scale. Matching vocabulary with visible graph parts helps young learners understand how a picture graph is organized. Special attention is given to the key because it determines the real value of each symbol. This activity provides a strong foundation for later comparison and calculation questions.
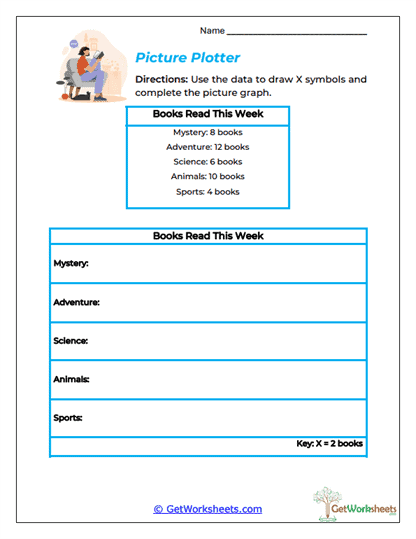
Picture Plotter
Students create a complete scaled pictograph from book-reading totals. A key shows that each symbol represents two books, requiring learners to convert each numerical value into the correct number of pictures. Building the entire graph develops independence with categories, scale, and data organization. The activity also reinforces skip counting and early division thinking.
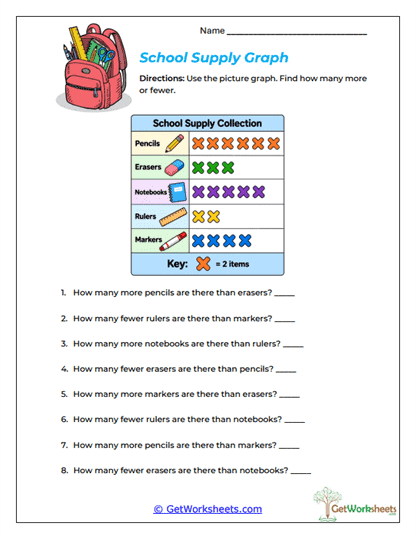
School Supply Graph
Students compare category totals on a scaled picture graph of school supplies. After applying a key in which each symbol represents two items, they determine which categories have more or fewer and calculate numerical differences. The activity connects pictograph reading directly with subtraction. It also strengthens comparison language and number sense.
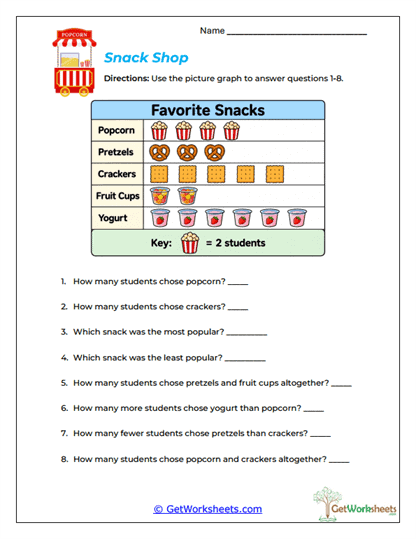
Snack Shop
Students interpret a scaled pictograph showing favorite snacks. Because each symbol represents two students, learners must apply the key before identifying totals, finding the most and least popular categories, combining values, or calculating differences. The activity moves beyond simple counting and requires several arithmetic skills. It provides strong practice with scaled picture graph reasoning.
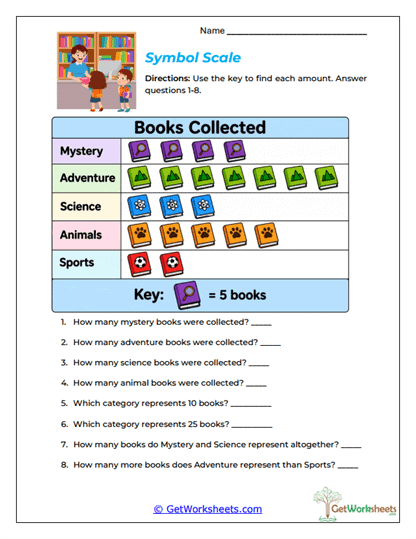
Symbol Scale
Students use a key showing that each picture represents five books to determine actual category totals. They count symbols, multiply or skip count by fives, compare categories, and combine values when needed. The activity focuses on understanding how the graph key controls the value of every picture. It strengthens multiplication readiness and scaled-data interpretation.
Bookmark Us Now!
New, high-quality worksheets are added every week! Do not miss out!