Pie Graphs Worksheets
About This Worksheet Collection
Pie or circle graphs help students understand how a whole can be divided into meaningful parts. Learners work with sectors, percentages, fractions, legends, and category totals to see how each slice represents part of 100%. These skills connect graphing with part-to-whole reasoning, percent sense, fraction understanding, and real-world data interpretation.
This collection gives upper elementary and middle school students several ways to practice reading, completing, comparing, and constructing pie graphs. Activities include identifying graph parts, reading sector percentages, finding missing values, matching fractions with percents, calculating category amounts from percentages, converting counts into percentages, completing incomplete graphs, matching percentage sets to sector descriptions, checking errors, analyzing budgets, constructing pie charts, and reviewing mixed skills. The worksheets are well suited for graphing units, percentage practice, financial literacy connections, independent work, tutoring, review, or homeschool instruction.
As students work through the collection, they strengthen percentage calculations, fraction-percent equivalence, sector comparison, part-to-whole reasoning, and graph interpretation. They also practice finding missing percentages, converting between counts and percents, calculating actual amounts from a total, judging whether a pie graph is accurate, and building sectors from raw data. These activities help learners understand both what pie graphs show and how the underlying math creates each part of the circle.
Detailed Descriptions Of These Worksheets
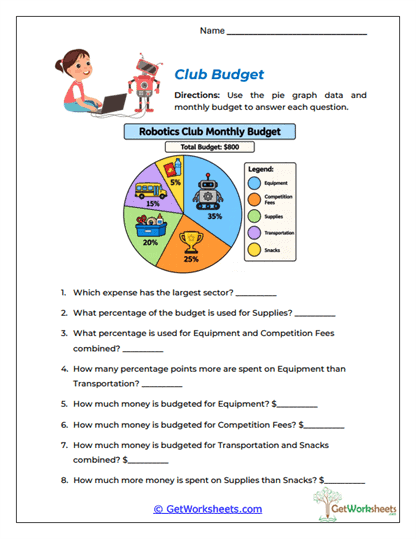
Club Budget
Students analyze a robotics club budget displayed as a pie graph and connect sector percentages with actual dollar amounts. They identify the largest and smallest categories, compare percentage-point differences, combine sectors, and calculate how much money is assigned to selected expenses. The budgeting context gives percent-of-a-number calculations a practical purpose. This activity strengthens graph interpretation and financial reasoning at the same time.
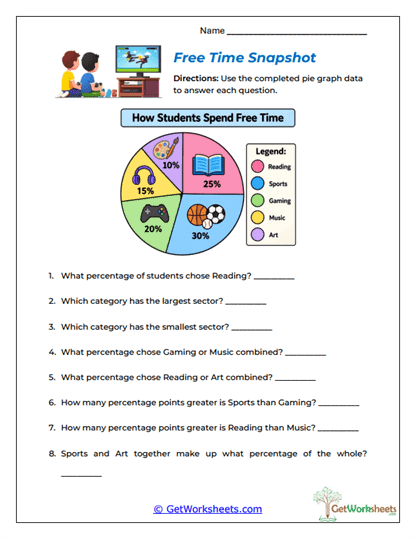
Free Time Snapshot
A completed pie graph shows how students spend their free time. Learners read exact percentages, identify the largest and smallest sectors, combine categories, and calculate differences between percentages. The activity encourages students to move between the visual graph and the numerical values. It strengthens percentage comparison, addition, subtraction, and part-to-whole understanding.
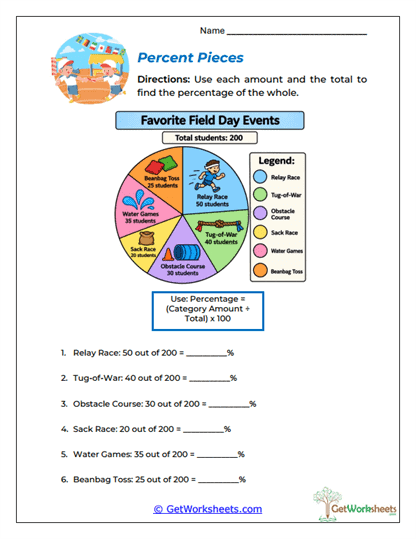
Percent Pieces
Students begin with category counts and a known total, then calculate the percentage represented by each category. Repeated use of part divided by whole times 100 helps learners understand how raw data becomes a pie graph sector. The activity connects tables with graphical percentages and reinforces proportional thinking. It also prepares students to construct their own pie charts.
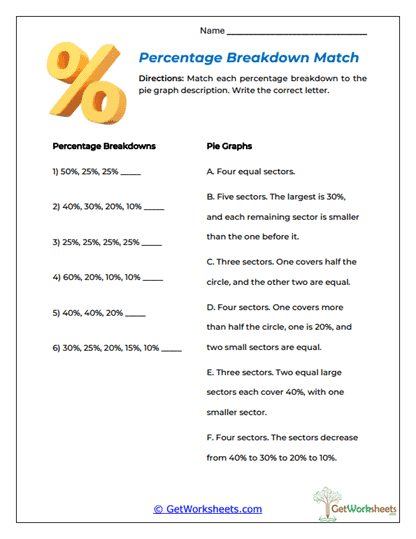
Percentage Breakdown Match
Different sets of percentages are matched with descriptions of how the corresponding pie graph would look. Students compare values, visualize relative sector sizes, and recognize when portions would be equal. The activity builds visual percent sense without requiring exact graph construction. It strengthens estimation, proportional reasoning, and sector comparison.
Pie Builder
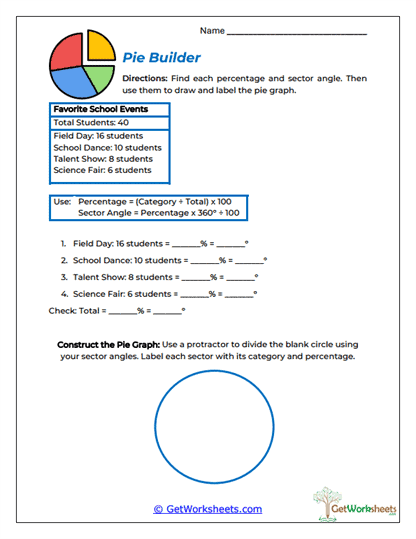
Students complete the full process of constructing a pie graph from raw data. They calculate category percentages, convert those percentages into sector angles, and use a protractor to divide a circle accurately. The finished graph is then labeled with categories and percentages. This activity combines percentages, degrees, measurement, proportions, and data representation.
Pie Checkpoint
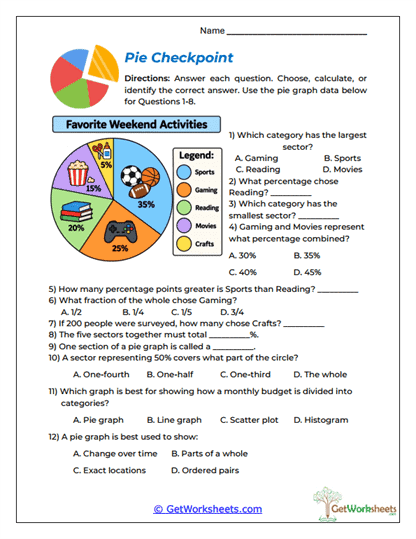
A mixed review checks understanding of percentages, fractions, sectors, totals, category comparisons, and appropriate graph use. Students switch among interpretation, arithmetic, fraction-percent equivalence, and conceptual questions. The varied format requires learners to decide which idea applies to each problem. This worksheet is useful for review, assessment, and identifying skills that need more practice.
Pie Percent Hunt
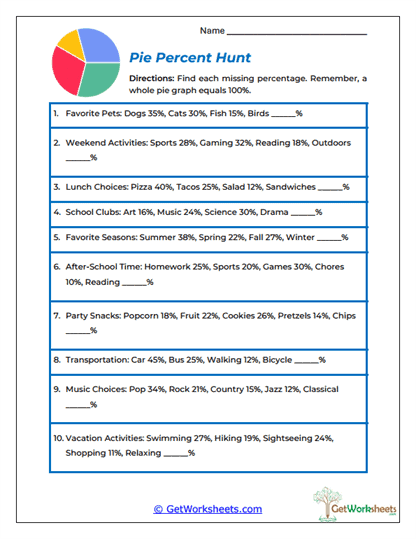
Several category percentages are provided with one value missing. Students add the known percentages and subtract the result from 100% to determine the missing sector. The activity reinforces the idea that every complete pie graph represents one whole. It strengthens percent addition, subtraction, and missing-value reasoning.
Pie Puzzle
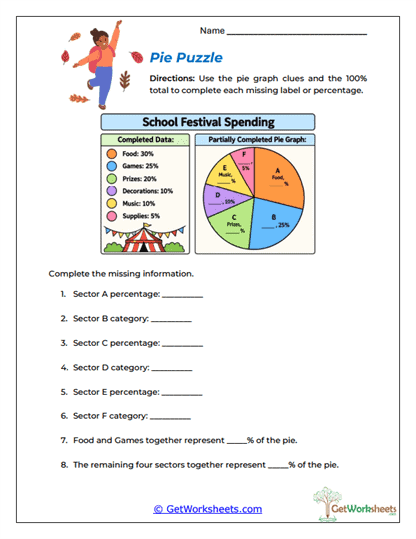
Students complete missing information in a partially finished pie graph using known category data and the 100% total. They determine missing percentages, match category labels, and combine sectors when needed. The puzzle format requires learners to use several pieces of information together. This activity develops stronger graph-to-data connections and multi-step reasoning.
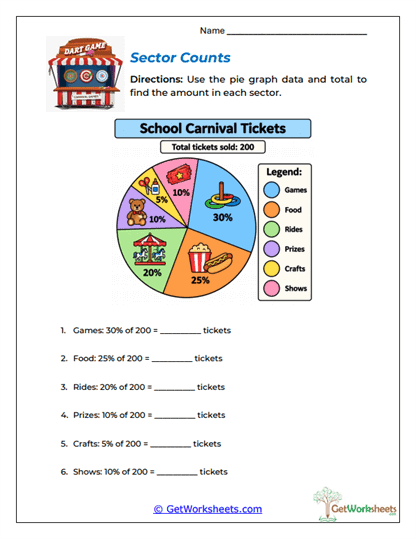
Sector Counts
Students use a known total and sector percentages to determine the actual number of items represented by each category. A carnival-ticket context gives percent-of-a-number calculations a clear real-world purpose. Learners connect each visual sector with both a percentage and a numerical amount. The activity strengthens multiplication, division, and data interpretation.
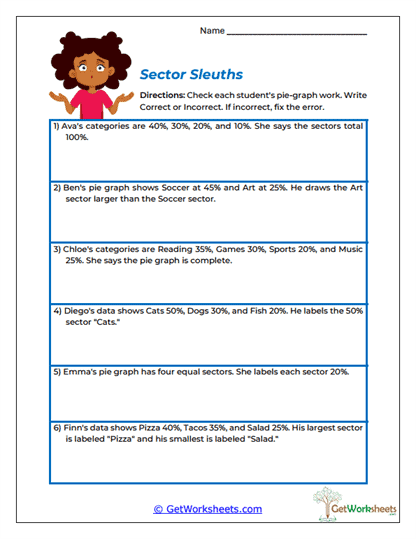
Sector Sleuths
Students inspect pie graph descriptions for possible errors. They check whether percentages total 100%, whether the largest values match the largest sectors, and whether labels and category sizes make sense. Incorrect examples must be explained and corrected. This error-analysis format builds graph accuracy, percentage reasoning, and careful mathematical communication.
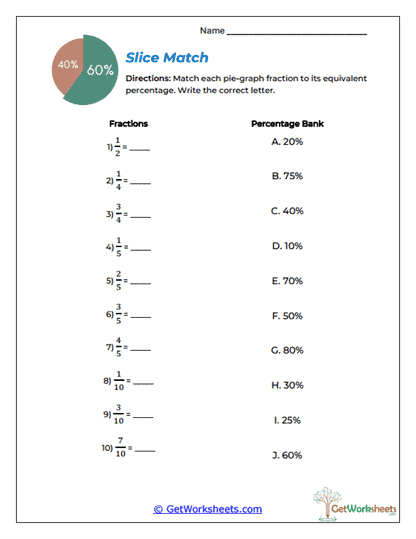
Slice Match
Common fractions are matched with their equivalent percentages. Students work with benchmark values such as one-half, one-fourth, three-fourths, and tenths to strengthen automatic recognition. The activity shows that the same part of a whole can be represented in multiple forms. It provides useful preparation for interpreting and constructing pie graph sectors.
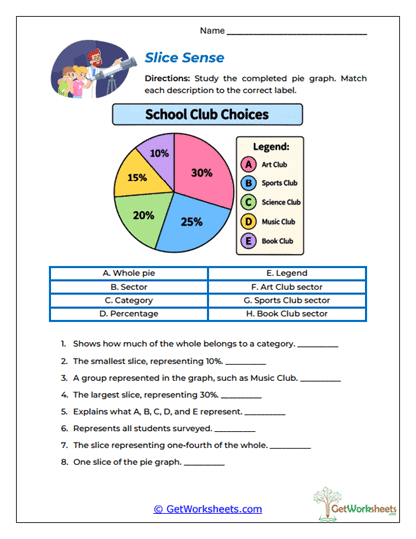
Slice Sense
Students identify the main parts of a pie graph, including the whole circle, sectors, categories, percentages, and legend. Matching each feature with its purpose helps learners understand how circular data displays are organized. The activity emphasizes that every sector represents part of the complete whole. It provides a strong foundation for later percentage and sector problems.
Bookmark Us Now!
New, high-quality worksheets are added every week! Do not miss out!