Club Budget
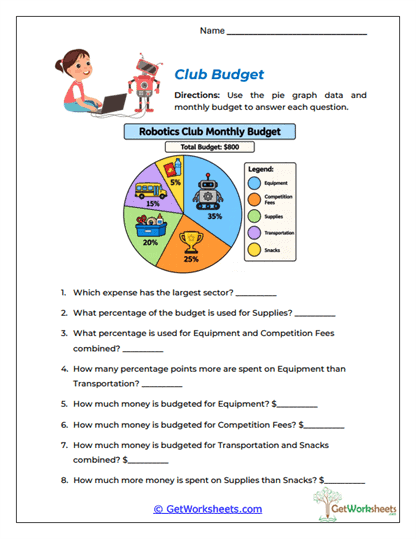
The Club Budget Worksheet helps students connect pie graph percentages to real dollar amounts by analyzing a monthly robotics club budget. Students study the pie graph, identify the largest and smallest expense categories, combine percentage values, compare sectors using percentage-point differences, and use the total budget to calculate how much money is assigned to different categories. This is a strong upper elementary and middle school graphing activity because students must move back and forth between percentages, dollar amounts, categories, and the overall total. The worksheet strengthens pie graph interpretation, percent-of-a-number calculations, addition, subtraction, comparison, budgeting, part-to-whole reasoning, and real-world data analysis.
Learning Goals
- Interpret Budget Sectors: Students identify which categories take up larger or smaller portions of the total budget.
- Calculate Dollar Amounts: Learners use the total budget and sector percentages to determine how much money is assigned to each category.
- Compare Percentages: Students find how many percentage points separate one budget category from another.
- Combine Categories: Learners add percentages or dollar amounts to analyze related expenses together.
Teaching Advantages
- Connects Math to Real Life: Budget data shows students how pie graphs can be used for practical financial planning.
- Combines Graphing and Percent Skills: Students practice percent calculations, addition, subtraction, and comparison in one activity.
- Builds Financial Awareness: The context introduces the idea that a fixed total must be divided among different needs.
- Low-Prep Resource: Works well for classwork, homework, tutoring, enrichment, review, or homeschool instruction.
Using a pie graph to analyze a budget helps students see why percentages matter outside of a math lesson. This worksheet reinforces pie graphs, percentages, dollar amounts, budgets, sectors, category totals, comparison, and part-to-whole relationships through a realistic spending example. Students build stronger reasoning because they must connect a visual sector to both a percent and a dollar value. In classroom and homeschool settings, this activity supports graph comprehension, financial literacy, percentage fluency, and confidence with real-world problem solving. These skills are useful for later work with discounts, taxes, savings plans, business data, and personal budgeting.
Bookmark Us Now!
New, high-quality worksheets are added every week! Do not miss out!