Sector Sleuths
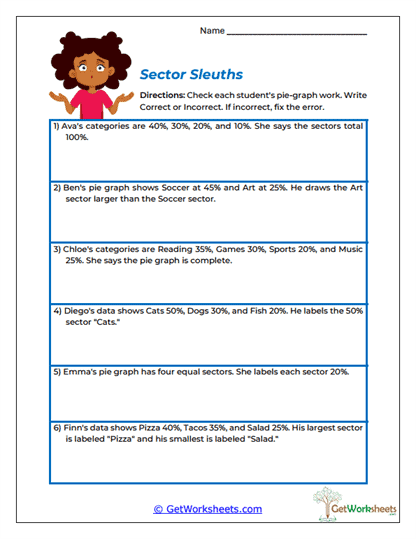
The Sector Sleuths Worksheet gives students an error-analysis activity where they examine several descriptions of pie graphs and decide whether each one is correct. Students check whether percentages add to 100%, whether the largest sector is labeled correctly, whether sector sizes match the given values, and whether category totals make sense. This is a valuable upper elementary and middle school graphing activity because students must apply several pie graph rules at once instead of completing one repeated procedure. The worksheet strengthens percentage totals, sector comparison, category labeling, graph accuracy, error analysis, part-to-whole reasoning, and mathematical explanation.
Academic Focus
- Check Percentage Totals: Students verify whether all categories combine to make a complete 100%.
- Evaluate Sector Size: Learners determine whether larger percentages are shown with larger sectors.
- Check Labels Carefully: Students make sure each sector is matched to the correct category.
- Explain Graphing Errors: The activity encourages learners to identify what went wrong and describe how it should be fixed.
Learning Benefits
- Builds Error Analysis Skills: Students learn from common pie graph mistakes and become better at checking their own work.
- Strengthens Percentage Reasoning: Learners repeatedly use the 100% rule and compare relative values.
- Encourages Mathematical Communication: Students explain why a graph is correct or incorrect instead of simply marking an answer.
- Flexible Practice: Works well for classwork, homework, tutoring, intervention, assessment, or homeschool review.
Checking pie graphs for errors helps students understand that a graph must accurately represent the data behind it. This worksheet reinforces percentages, sectors, totals, categories, labels, part-to-whole relationships, graph accuracy, and error analysis through realistic examples. Students build stronger reasoning because they must compare numerical information with how the graph is described. In classroom and homeschool settings, this activity supports percentage fluency, graph comprehension, attention to detail, and confidence. Learning to find and correct mistakes also prepares students to create more accurate pie graphs and evaluate data displays independently.
Bookmark Us Now!
New, high-quality worksheets are added every week! Do not miss out!