Percent Error and Accuracy Worksheets
About This Worksheet Collection
Percent error gives students a way to describe how far a measurement or estimate is from an accepted value while also accounting for the size of the quantity being measured. A mistake of 2 units can be minor in one situation and substantial in another, so learners must look beyond the raw difference and compare that error with the actual value. This makes percent error an important connection among measurement, proportional reasoning, data analysis, scientific accuracy, and percent calculation.
The worksheets in this collection explore percent error through direct computation, data tables, matching, multiple-choice questions, error analysis, comparison tasks, laboratory measurements, everyday estimates, and common measuring tools. Students find absolute error, divide by the actual or accepted value, convert the result to a percent, round when necessary, and compare multiple measurements for accuracy. Several activities also require learners to judge completed work or determine which result is most precise, encouraging them to interpret the percentage rather than stop once the arithmetic is finished.
As students progress, they develop a clearer sense of what accuracy means mathematically. They learn that smaller percent errors generally indicate measurements closer to the accepted value, that the actual value must be used as the reference point, and that the same numerical error can have very different significance depending on scale. These habits support later work in science labs, experimental design, measurement, statistics, engineering, and any setting where the quality of numerical data matters.
Detailed Descriptions Of These Worksheets
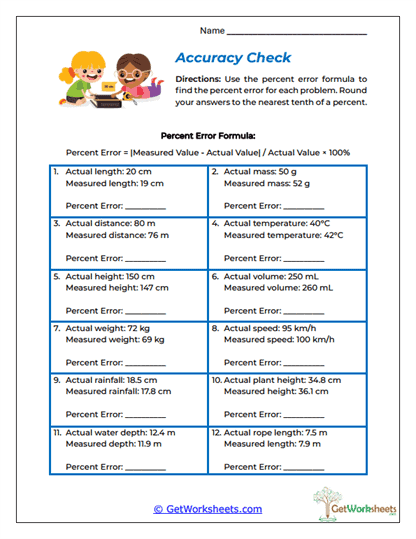
Accuracy Check
Students calculate percent error from pairs of actual and measured values drawn from a range of measurement settings. They first determine the absolute difference, then compare that difference with the accepted value before converting the result into a percentage. Length, mass, temperature, speed, rainfall, volume, and other quantities keep the calculations connected to realistic measurement. The worksheet establishes a clear foundation for understanding percent error as the relative size of a mistake.
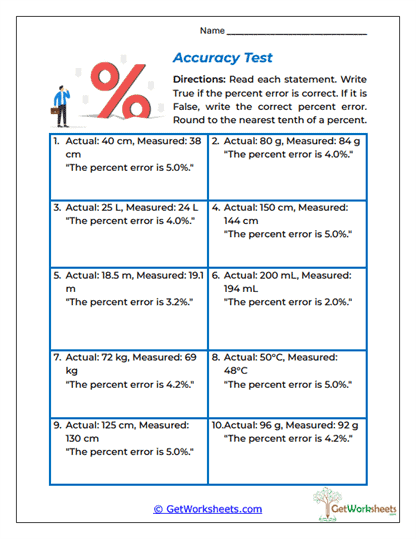
Accuracy Test
Completed percent-error statements are presented for students to verify. Learners decide whether each claim is true or false, recalculate the percentage when necessary, and pay close attention to rounding and denominator choice. This turns percent error into a checking task rather than a simple calculation exercise. The activity helps students develop the habit of questioning whether a reported accuracy measure is mathematically believable.
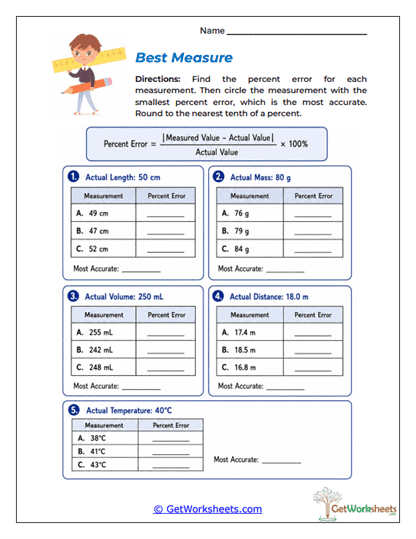
Best Measure
Several possible measurements are compared with the same actual value. Students calculate the percent error for each choice and then identify which measurement is most accurate. The task moves beyond formula practice by requiring learners to interpret smaller percent error as a stronger result. This makes the relationship between error size and measurement quality especially clear.
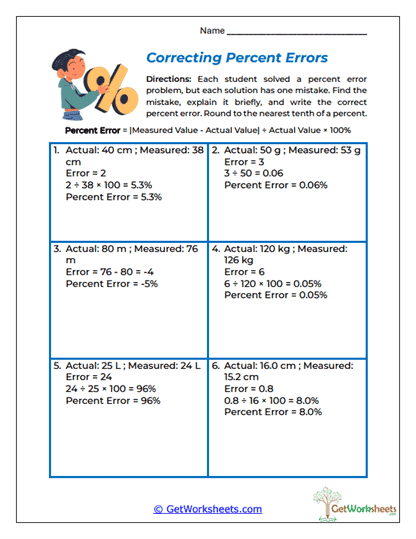
Correcting Percent Errors
Students investigate worked examples that contain deliberate mistakes. Each problem may involve an incorrect absolute difference, the wrong denominator, a faulty percent conversion, or another error in the process. Learners identify what went wrong, explain it, and then produce the correct percent error. This diagnosis-based format strengthens conceptual understanding and makes common mistakes easier to recognize in future work.
Data Accuracy Table
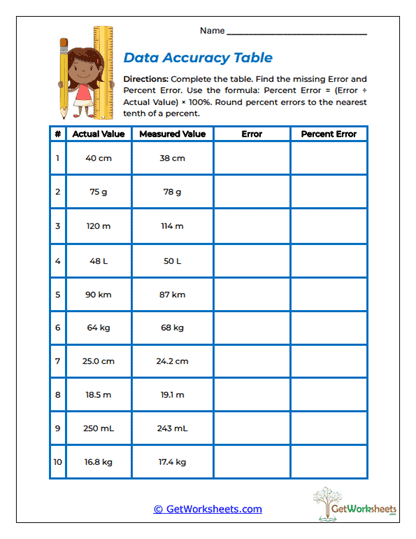
Actual values, measured values, numerical errors, and percent errors are organized into a structured table. Students complete the missing columns one step at a time, which makes the relationship among the quantities visible. The format resembles the way measurement data is often recorded in laboratory settings. It is particularly useful for reinforcing an organized process and showing where an incorrect result may have originated.
Error Matching
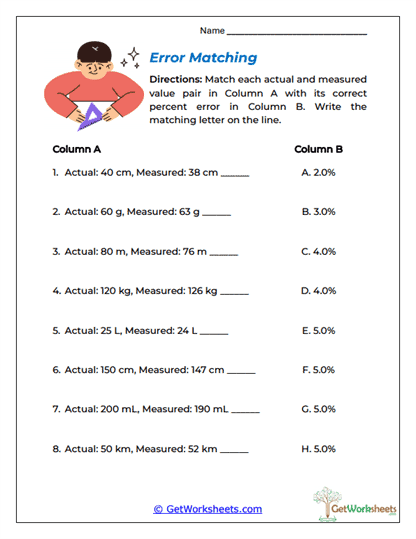
Students calculate percent errors and match each measurement pair with the appropriate percentage from an answer bank. The matching structure introduces elimination and provides natural feedback if a calculated result cannot be found. Small percent errors encourage learners to estimate whether an answer should be closer to 2%, 5%, or another nearby value before finalizing it. This builds fluency while reinforcing the meaning of accuracy.
Error Search
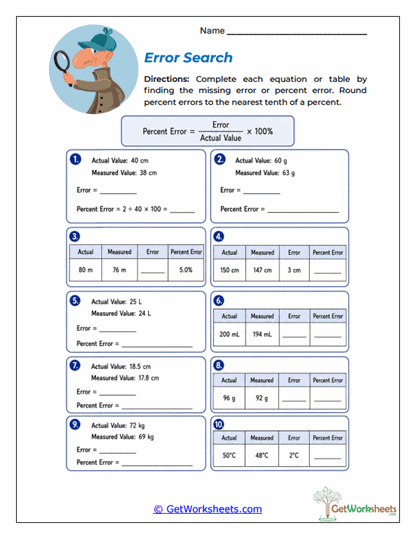
Equations and compact tables are mixed together, with different pieces of the percent-error process left blank. Students may need to find the numerical error in one problem and the percentage in another. Switching formats forces learners to identify what information is already known instead of relying on one repeated visual pattern. The activity develops flexible problem solving and prepares students for data presented in unfamiliar forms.
Estimate Check
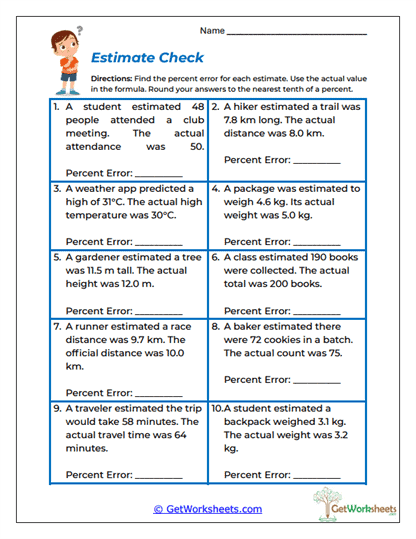
Everyday estimates are compared with actual results to determine how accurate the predictions were. Attendance, distance, temperature, weight, time, quantity, and similar contexts show that percent error is useful well beyond formal laboratory measurements. Students see that a small raw difference can still represent a large percentage when the actual value is small. This helps build stronger estimation sense and more meaningful interpretation of error.
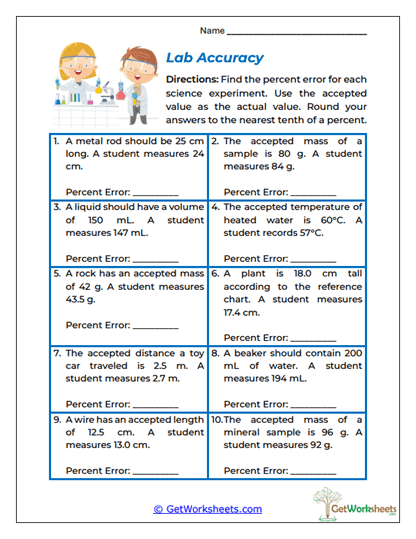
Lab Accuracy
Science experiments provide the setting for comparing accepted values with student measurements. Learners calculate percent error for masses, volumes, temperatures, lengths, distances, and other quantities that resemble laboratory data. The scientific context gives the formula a clear purpose: evaluating how closely an experimental result matches an expected value. This makes the worksheet especially useful for integrated math, science, and STEM instruction.
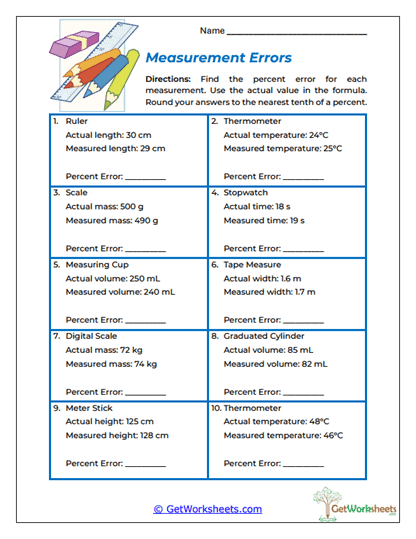
Measurement Errors
Familiar tools such as rulers, scales, thermometers, stopwatches, measuring cups, and graduated cylinders become sources of measured values. Students determine how far each result differs from the actual amount and express that difference as percent error. Working across several units emphasizes that the same mathematical process applies regardless of the measuring instrument. The activity also encourages students to think more carefully about the imperfections that naturally occur during measurement.
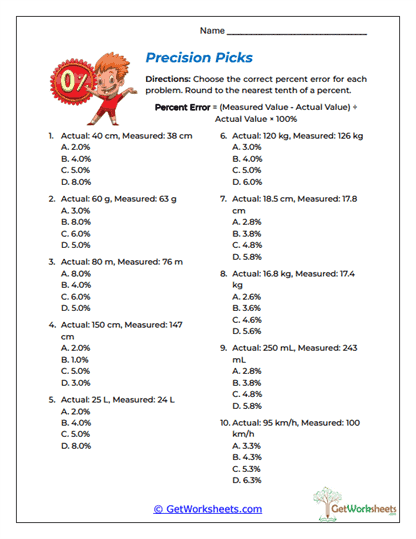
Precision Picks
Multiple-choice questions ask students to calculate percent error and select the correct result from several close possibilities. Careful subtraction, denominator choice, decimal conversion, and rounding are all important because small mistakes may lead directly to a distractor option. Students can also use estimation to decide whether a percentage seems reasonable before completing the exact calculation. This format supports both fluency and test-style decision making.
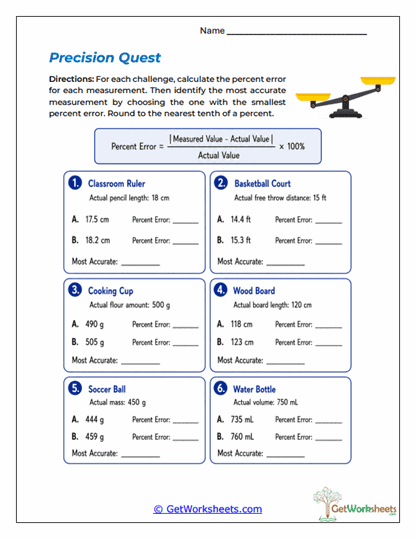
Precision Quest
Two competing measurements are compared with the same accepted value in each problem. Students calculate both percent errors and choose the more accurate result based on which error is smaller. The comparison requirement gives the percentage an immediate interpretive purpose rather than treating it as an endpoint. This activity develops stronger mathematical judgment while reinforcing how precision and accuracy are evaluated in measurement and scientific work.
Bookmark Us Now!
New, high-quality worksheets are added every week! Do not miss out!