Data Accuracy Table
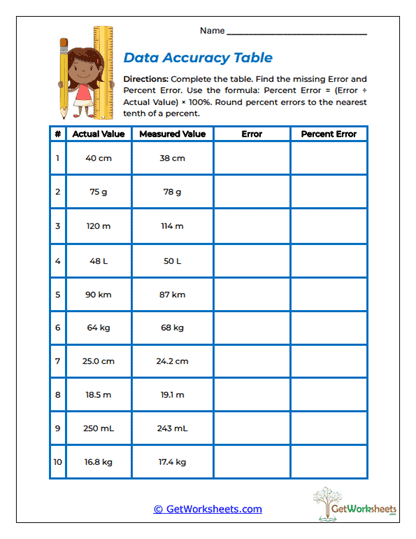
This worksheet organizes percent error into a clean table where students can see the entire process from actual value to measured value, numerical error, and final percent error. Students work with measurements such as 40 cm compared with 38 cm, 75 g compared with 78 g, 120 m compared with 114 m, and 250 mL compared with 243 mL, then complete the missing Error and Percent Error columns. The structured format strengthens subtraction, absolute difference, division, percent conversion, rounding, table reading, and measurement sense while helping students understand that percent error is a multi-step calculation rather than a single operation. It is especially useful for grades 6-8 students who benefit from having each part of the process separated visually.
Key Learning Objectives
- Calculate the Error First: Students find the absolute difference between the actual and measured values.
- Use the Actual Value as the Reference: Learners divide the error by the actual value before converting to a percent.
- Complete a Data Table: Students practice organizing information across several mathematical columns.
- Compare Accuracy Across Measurements: Learners begin noticing that smaller percent errors indicate measurements that are closer to the accepted value.
Educational Value
- Great for Students Who Need Structure: The table makes each step visible and prevents students from mixing up the values.
- Parent-Friendly Routine: Adults can move across the row with the child: “actual, measured, difference, percent.”
- Makes Mistakes Easier to Find: If the percent error looks wrong, students can check whether the numerical error was calculated correctly first.
- Builds Lab-Style Organization: The format resembles the way measurement data is often recorded in science.
- Useful for Review or Assessment: Teachers can quickly see whether difficulty comes from subtraction, division, or percent conversion.
This worksheet is especially helpful because it slows the process down just enough for students to understand what each number means. Actual values, measured values, numerical error, percent error, units, rounding, and number sense all work together across every row. For parents, the chart makes the process less intimidating because there is no need to hold the entire formula in mind at once. A student can first find the difference, then compare that difference with the actual value, and finally convert the result to a percent. In classroom and homeschool settings, this activity builds organized mathematical thinking and prepares students for science labs, measurement comparisons, and more advanced data analysis.
Bookmark Us Now!
New, high-quality worksheets are added every week! Do not miss out!