Finding the Percent Given the Part and Whole Worksheets
About This Worksheet Collection
Finding the percent from a part and a whole is one of the most practical ways students begin using percentage relationships. Instead of being handed a percent directly, learners must interpret how one amount compares with a total and express that relationship out of 100. This brings together fractions, division, decimals, ratio thinking, and percent notation in a way that strengthens both procedural skill and proportional reasoning.
The worksheets in this collection approach the part-whole-percent relationship through direct calculation, structured tables, matching, multiple-choice questions, shaded models, error analysis, surveys, sports statistics, goal tracking, school performance, and other applied contexts. Students repeatedly identify the part, identify the whole, divide one by the other, and convert the result into a percentage. The variety of formats helps grades 5-6 students understand not only how to use the formula, but also how to recognize the part and whole in different situations.
As students progress, they become better at estimating whether a result is reasonable before completing the exact calculation. Familiar relationships such as one-fourth, one-half, and three-fourths give them useful benchmarks for interpreting percentages quickly. These habits help learners develop stronger percent sense and prepare them for later work with rates, probability, data, discounts, grades, statistics, and proportional comparisons.
Detailed Descriptions Of These Worksheets
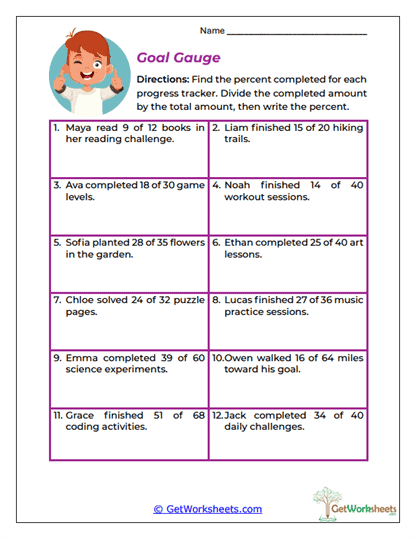
Goal Gauge
Students calculate how much of a goal has been completed by comparing progress with the total target. Reading plans, workouts, projects, games, and other familiar goals make the idea of percent complete easy to interpret. Each problem reinforces that the completed amount is the part and the full goal is the whole. This gives percent calculation a practical connection to planning and progress tracking.
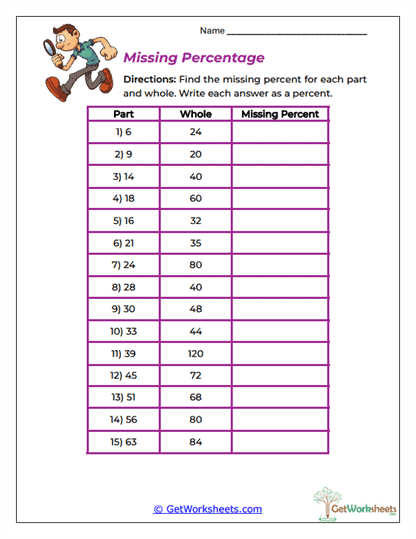
Missing Percentage
A clean table presents repeated part-and-whole relationships with the percentage missing. Students move across each row, divide the part by the whole, and convert the result into percent form. The predictable structure is useful for building fluency while still requiring careful attention to which number represents the total. Many examples can also be simplified mentally through familiar fraction relationships.
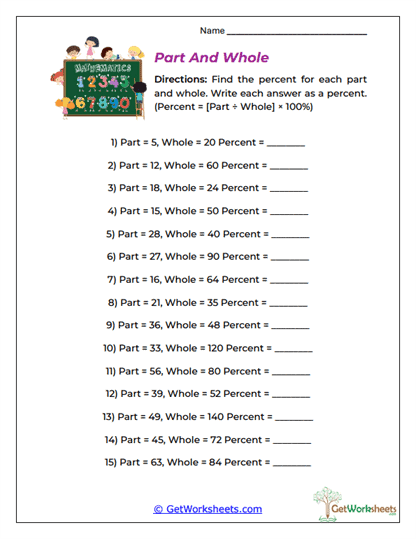
Part And Whole
This worksheet isolates the essential percent relationship without adding extra reading or context. Students are given two numbers and determine what percent the part represents of the whole using division and multiplication by 100. Because the setup remains consistent, attention stays on understanding the calculation itself. It provides a strong foundation before students move into more complex percentage word problems.
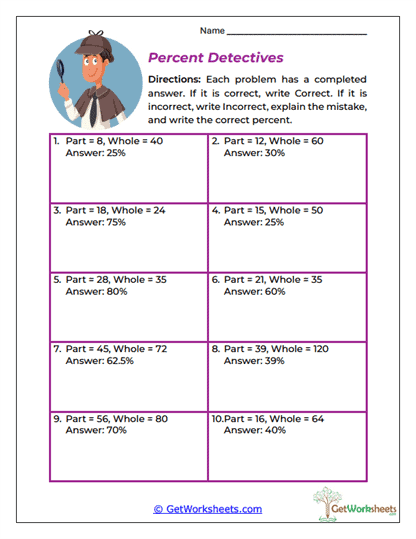
Percent Detectives
Students inspect completed percent calculations and decide whether each answer is trustworthy. When an answer is wrong, they must identify the mistake, explain what happened, and replace it with a correct result. This shifts the task from simply solving to analyzing someone else's reasoning. The activity develops strong self-checking habits and helps students recognize common errors involving division order and decimal-to-percent conversion.
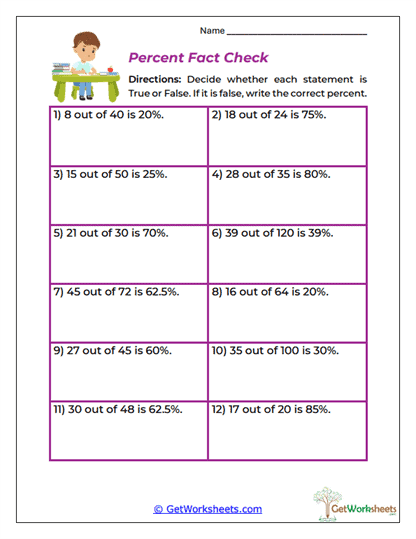
Percent Fact Check
True-or-false statements ask students to verify whether a stated percentage accurately describes a given part of a whole. Familiar fraction benchmarks provide a useful first check before exact calculation is performed. Incorrect statements must be corrected, giving students practice repairing mathematical reasoning rather than simply labeling it wrong. The format reinforces both calculation and reasonableness.
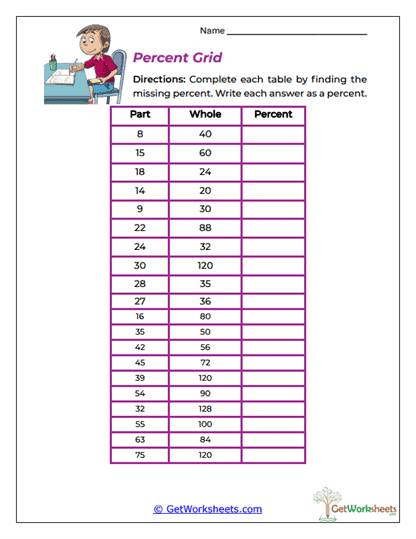
Percent Grid
Students complete a table containing part, whole, and percent columns. The layout keeps the relationship visually organized and makes it easier to see how the same calculation applies across different number pairs. Repetition helps students become faster while still reinforcing the distinction between the amount being considered and the total amount. The activity is particularly useful for learners who benefit from structured mathematical organization.
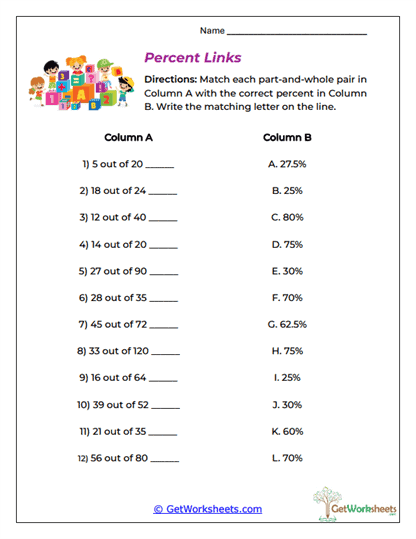
Percent Links
Part-and-whole pairs are matched with the correct percentages from an answer bank. Students calculate each relationship first and then search for the equivalent percent. The matching structure introduces elimination and built-in feedback, since a missing result can signal that the earlier calculation should be checked. This helps common percent relationships become easier to recognize over time.
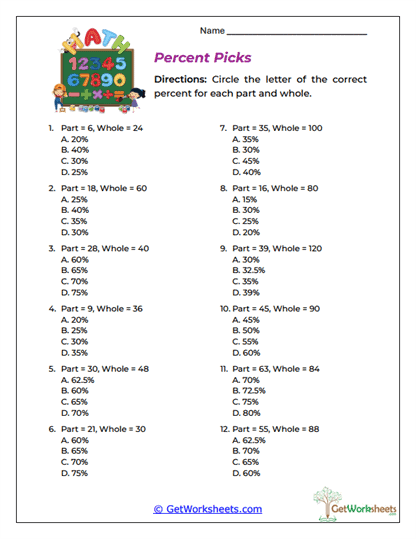
Percent Picks
Students calculate the percentage represented by a part-and-whole pair and then choose from several possible answers. The answer choices encourage learners to estimate first, compare magnitudes, and reject percentages that are clearly too high or too low. Familiar fractional relationships can often make the calculation more efficient. The worksheet blends computation with judgment and test-style reasoning.
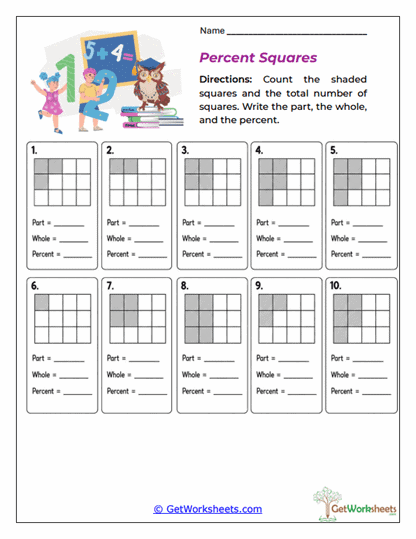
Percent Squares
Shaded grids turn percentage relationships into something students can see. Learners count the shaded portion, count the total number of squares, and then calculate the percent represented by the model. This creates a direct connection among visual fractions, numerical ratios, decimals, and percentages. The worksheet is especially effective for students who need a concrete representation of what "part of a whole" actually means.
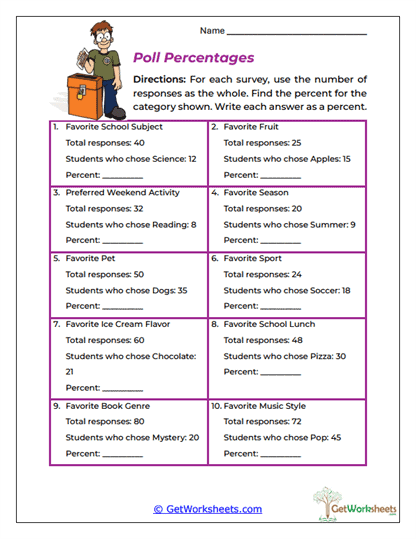
Poll Percentages
Survey results provide a realistic source of part-and-whole data. Students determine what percentage of respondents selected a particular preference by comparing that group with the total number surveyed. The context reinforces why percentages are useful when comparing polls with different sample sizes. It also connects naturally with later work involving graphs, tables, and data interpretation.
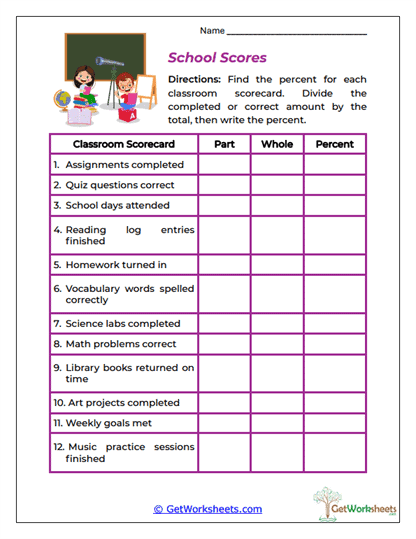
School Scores
Classroom performance data is used to show how percentages summarize accuracy, completion, attendance, and progress. Students compare completed or correct items with the total possible and calculate the corresponding percentage. Because the situations resemble grades and progress reports, the mathematics feels immediately relevant. The scorecard format also strengthens table reading and data organization.
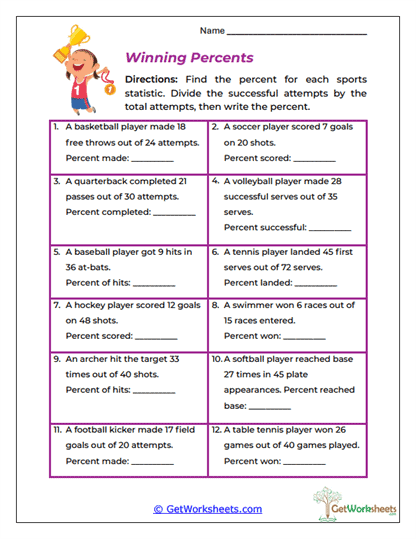
Winning Percents
Sports statistics turn part-whole percentages into rates of success. Students calculate shooting percentages, serving accuracy, passing rates, race success, and other performance measures by comparing successful attempts with total attempts. The problems show why percentages allow fair comparison even when athletes have different numbers of opportunities. This builds a strong bridge between percent calculations, ratios, and real-world statistics.
Bookmark Us Now!
New, high-quality worksheets are added every week! Do not miss out!