Percent Change Worksheets
About This Worksheet Collection
Percent change gives students a way to describe how much a quantity has grown or declined relative to where it began. The calculation may look simple, but the reasoning is layered: learners must identify the original value, determine the amount of change, decide whether the movement is an increase or decrease, and compare that change with the starting amount. This makes percent change an important bridge between basic percentage skills and more advanced work with data, rates, financial mathematics, and quantitative interpretation.
The worksheets in this collection develop that reasoning through direct calculations, tables, matching activities, multiple-choice questions, error analysis, and applied data sets. Students examine price changes, sports statistics, weather measurements, school-related data, and other before-and-after situations while repeatedly using the original value as the reference point. Several activities also ask learners to verify completed work or explain why a percent-change result is incorrect, helping them understand the structure behind the formula rather than rely on memorization alone.
As students move through the collection, they become better at predicting the direction and approximate size of a change before calculating it exactly. They learn that an increase and a decrease of the same numerical amount do not necessarily represent the same percentage, that context affects how a change should be interpreted, and that the original quantity matters throughout the calculation. These habits strengthen number sense, proportional reasoning, data literacy, and the ability to evaluate changes in real-world situations.
Detailed Descriptions Of These Worksheets
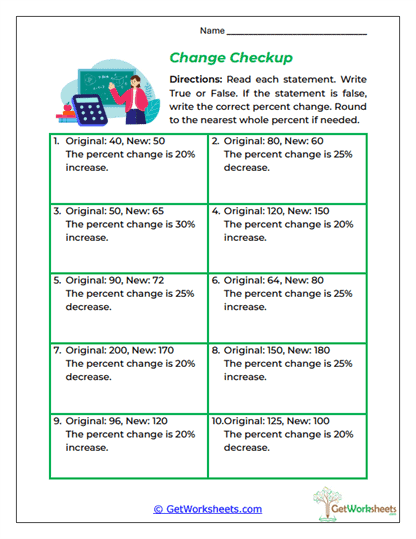
Change Checkup
Students act as reviewers of completed percent-change statements and decide whether each one is correct. They must verify both the numerical percentage and the increase-or-decrease label, which requires checking the full process rather than one isolated step. Incorrect examples are repaired using the original value as the reference point. This develops strong self-checking habits and exposes common mistakes involving direction, subtraction, and denominator choice.
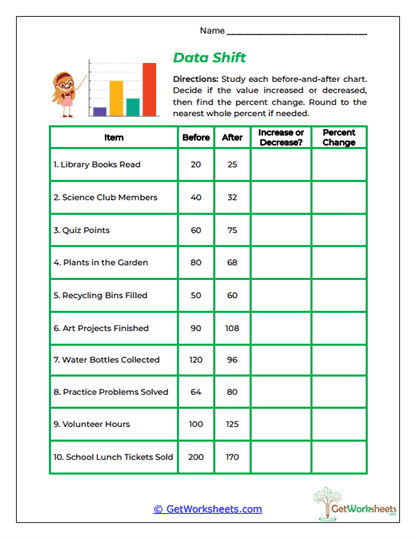
Data Shift
Everyday data provides the setting for before-and-after comparisons involving reading, clubs, projects, recycling, volunteering, and other familiar quantities. Students identify whether each value increased or decreased and then calculate the size of that change as a percentage of the original. The table format keeps the data organized while encouraging interpretation alongside computation. The activity helps students see percent change as a useful way to summarize shifts in real information.
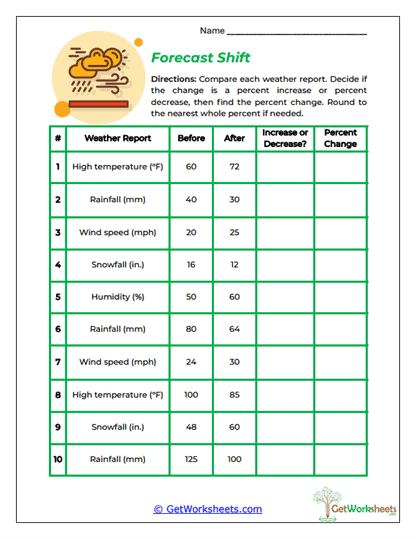
Forecast Shift
Weather-style measurements bring percent change into a science-oriented context. Learners compare temperature, rainfall, wind speed, snowfall, humidity, and other changing values, then calculate how large each shift is relative to the starting measurement. Because the units vary, students must separate the percent-change process from the type of quantity being measured. This strengthens data literacy and shows that the same mathematical reasoning can be applied across very different kinds of measurements.
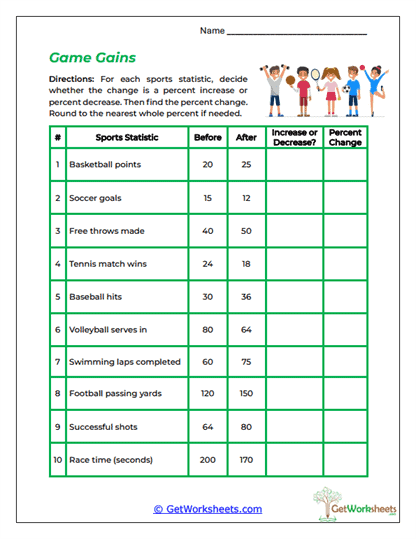
Game Gains
Sports statistics provide a lively setting for analyzing change over time. Students compare before-and-after performance figures such as points, goals, hits, serves, laps, passing yards, and race times before finding the percent increase or decrease. The context adds an important interpretive layer because a numerical decrease is not always undesirable; for example, a lower race time may signal improvement. This helps learners distinguish the mathematics of change from the meaning of the result.
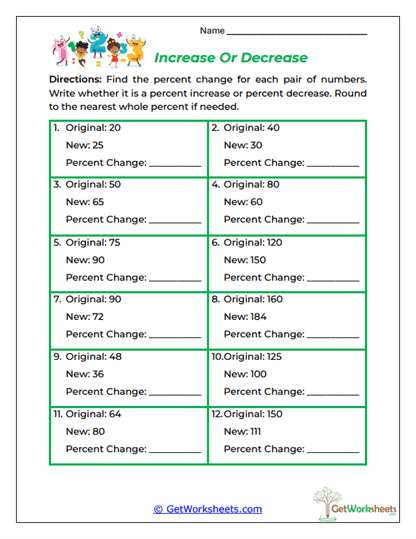
Increase Or Decrease
This worksheet introduces the complete percent-change process in a straightforward format. Students compare original and new values, calculate the numerical difference, decide whether the amount rose or fell, and then express the change as a percentage of the original value. Working with both directions from the start prevents students from associating percent change only with growth. The activity establishes a dependable routine before more contextual applications are introduced.
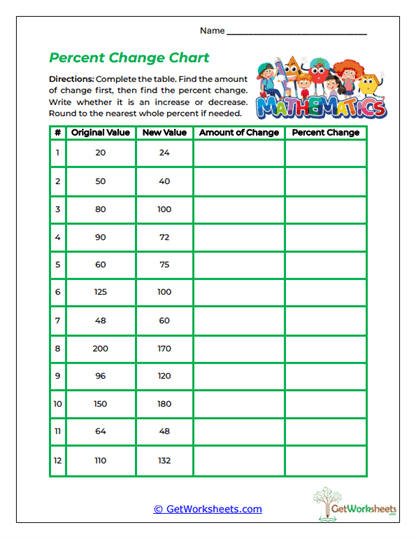
Percent Change Chart
A structured table separates the original value, new value, amount of change, direction, and final percent. This makes the sequence of reasoning visible and helps students trace mistakes back to the exact stage where they occurred. Repeated rows build fluency without hiding the multi-step nature of the calculation. The organized layout is especially useful for learners who benefit from seeing the entire percent-change chain at once.
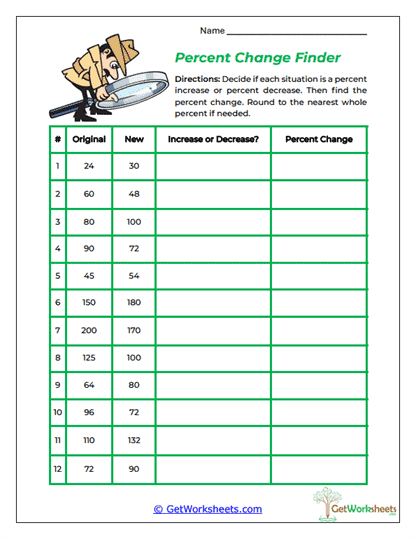
Percent Change Finder
Students complete the full process independently after being given only the original and new values. They first identify whether the value increased or decreased, then determine the numerical change and calculate the percent. Because the worksheet provides less step-by-step prompting, learners must manage the sequence on their own. This makes it a useful bridge from guided practice to more independent percent-change work.
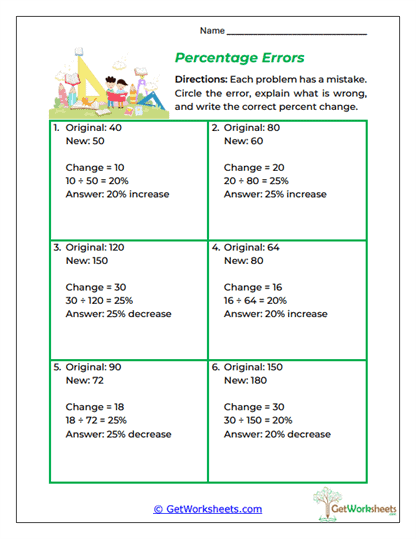
Percentage Errors
Completed problems contain mistakes that students must diagnose and repair. Learners inspect the amount of change, denominator, percent conversion, and increase-or-decrease label to determine exactly where the reasoning failed. The activity focuses heavily on the importance of dividing by the original value rather than the new one. By analyzing faulty work, students gain a clearer understanding of why the formula is structured the way it is.
Percentage Picks
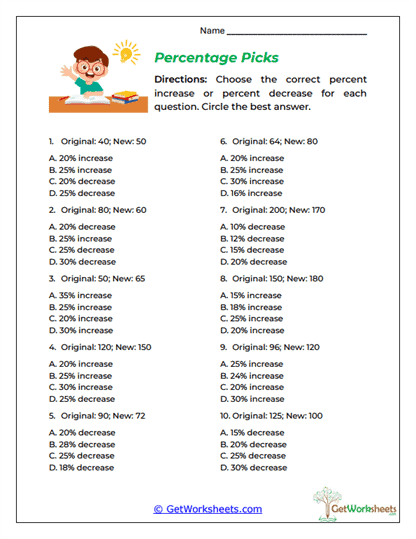
Multiple-choice questions ask students to determine the correct percent increase or decrease from several possibilities. The answer choices often reflect common errors, making estimation and number sense useful before exact calculation begins. Students can eliminate options that use the wrong direction or an unreasonable percentage. The format builds confidence with test-style problems while reinforcing the role of the original value.
Price Watch
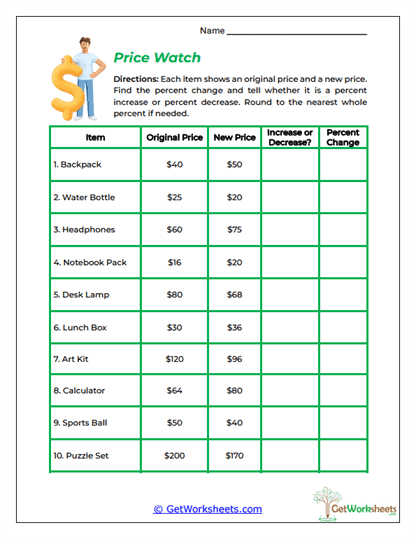
Original and new prices give percent change an immediate financial purpose. Students calculate how much an item's price rose or fell and express that movement as a percentage of the old price. The shopping context helps learners understand why raw dollar differences alone do not always tell the full story. This worksheet also creates a strong foundation for later work with inflation, discounts, markups, budgets, and consumer mathematics.
The Missing Percent
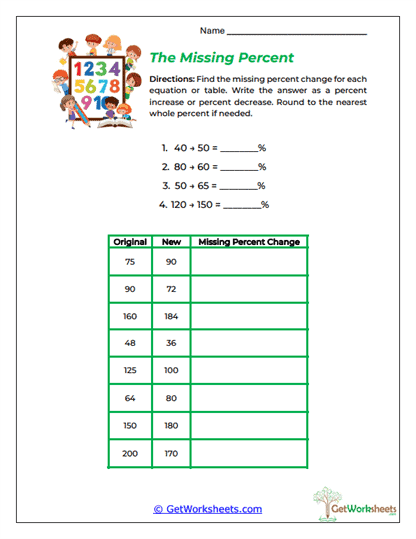
Students are given original and new values and must supply the percent change, sometimes in simple number-pair form and sometimes in a table. The mixed presentation helps learners recognize that the underlying relationship remains the same even when the layout changes. Both increases and decreases appear throughout the page. The activity provides focused fluency practice while reinforcing the core formula without unnecessary story details.
Value Pair Match
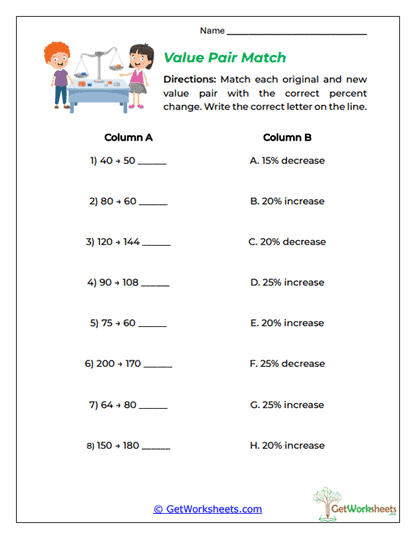
Original-and-new number pairs are matched with the correct percent-change descriptions from an answer bank. Students calculate both the size and direction of each change before locating the corresponding result. The matching format introduces elimination and self-checking, since an unavailable answer suggests that the calculation should be revisited. This puzzle-like structure gives repeated practice a more interactive feel while still emphasizing accurate reasoning.
Bookmark Us Now!
New, high-quality worksheets are added every week! Do not miss out!