Scoreboard Stats
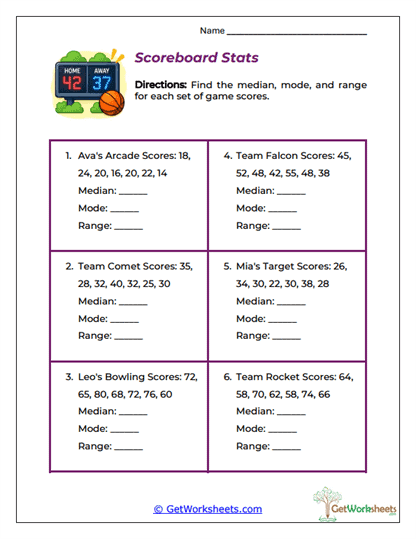
Sports scores provide an engaging opportunity for students to explore how statistical measures describe individual performance and team results. This practical statistics activity for Grades 5-7 presents six numerical data sets featuring arcade scores, basketball results, bowling scores, and team performances. Students examine each collection of scores, organize the values when necessary, identify the middle observation, determine the most frequently occurring score, and calculate the difference between the highest and lowest results. The exercises reinforce median calculations, mode identification, range analysis, numerical ordering, frequency comparisons, and data interpretation while demonstrating how statistics can summarize athletic and recreational performance.
Academic Focus
-
Finding Median Scores: Arrange recorded results from least to greatest and identify the central score in each distribution.
-
Identifying the Mode: Determine which score appears most frequently and recognize patterns in repeated performances.
-
Calculating Score Ranges: Subtract the lowest score from the highest to measure the spread between extreme results.
-
Interpreting Sports Data: Understand how median, mode, and range provide different perspectives on numerical performance.
Learning Benefits
-
Six Real-World Scenarios: Connects mathematical statistics with arcade games, basketball, bowling, and team competitions.
-
Integrated Statistical Practice: Requires students to calculate all three measures for every numerical collection.
-
Consistent Problem Structure: Separate answer spaces for median, mode, and range encourage organized mathematical thinking.
-
Cross-Curricular Connections: Offers opportunities to connect mathematics with physical education, sports performance, and recreational activities.
-
Flexible Instructional Use: Suitable for guided lessons, independent practice, math centers, homework, and homeschool statistics instruction.
Analyzing sports scores helps students recognize how statistical measures can describe the characteristics of a numerical data set. Through median identification, frequency analysis, range calculations, and numerical comparisons, learners strengthen mathematical fluency and statistical reasoning. Teachers can extend the activity by asking students to compare different score distributions and explain why a smaller range may indicate more consistent results. This printable reinforces problem-solving confidence, data literacy, computational accuracy, and understanding of measures of center and spread while preparing students to interpret sports statistics, compare performances, and analyze more complex numerical information.
Bookmark Us Now!
New, high-quality worksheets are added every week! Do not miss out!