Proportional vs. Non-Proportional Relationships Worksheets
About This Worksheet Collection
Proportional and non-proportional relationships ask students to look beyond individual numbers and identify the structure connecting two quantities. In a proportional relationship, the quantities share a constant multiplicative relationship and begin together at zero; in a non-proportional relationship, that pattern breaks because the ratio changes or an initial amount shifts the relationship away from the origin. This collection helps students recognize those differences across the forms they are most likely to encounter in middle-school math.
The worksheets move among tables, equations, graphs, ordered pairs, and real-world situations so learners cannot rely on a single shortcut. Students calculate y/x, identify the constant of proportionality, distinguish y = kx from equations with nonzero starting values, check whether lines pass through the origin, compare pairs of relationships, and analyze contexts involving taxi fares, fundraising, fees, and other constant-rate situations. Several activities mix representations on the same page, requiring students to choose the correct proportionality test for the information they are given.
By working across these formats, students begin to see tables, equations, graphs, and situations as different representations of the same underlying relationship. They learn that a constant rate alone is not always enough, that proportional equations have no extra starting term, and that proportional graphs pass through (0,0). These connections build a strong foundation for linear functions, slope, y-intercepts, unit rates, algebraic modeling, and more advanced work with proportional reasoning.
Detailed Descriptions Of These Worksheets
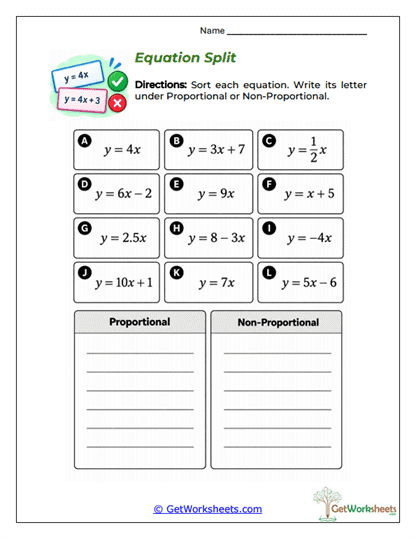
Equation Split
Students sort equations according to whether they represent proportional or non-proportional relationships. Expressions in the form y = kx belong in the proportional group, while equations containing an additional nonzero constant term do not. The activity teaches learners to recognize proportionality directly from algebraic structure. It also provides an early bridge to understanding slope-intercept form and the role of a y-intercept.
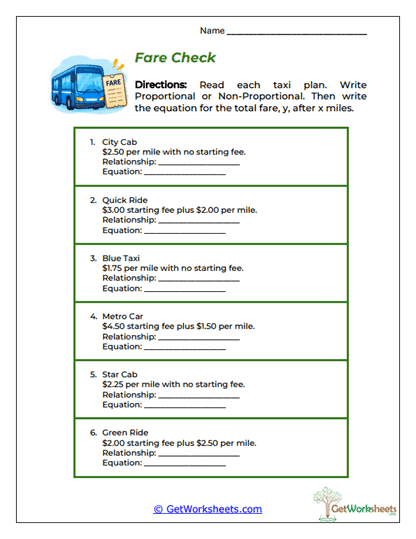
Fare Check
Taxi pricing plans provide a practical setting for distinguishing rate-only relationships from those with starting fees. Students classify each fare plan and write an equation for the total cost after a given number of miles. A per-mile charge with no initial fee produces a proportional relationship, while a base fare creates a non-proportional one. This context makes coefficients and constant terms easier to interpret.
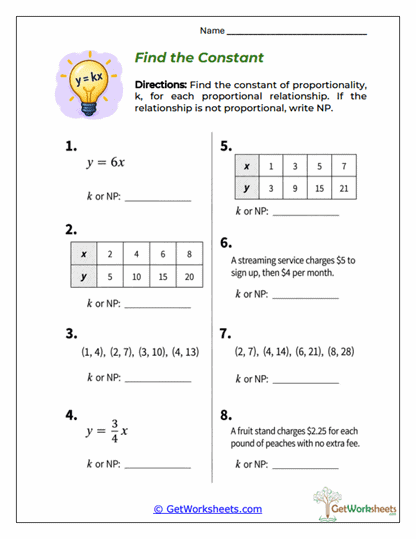
Find the Constant
Students determine the constant of proportionality, k, when a relationship is proportional and identify non-proportional examples when no single constant exists. Equations, tables, ordered pairs, and real-world situations all appear, requiring different methods for finding or testing k. The worksheet emphasizes that the same constant relationship can be expressed in several forms. This makes k more meaningful than simply treating it as a symbol in y = kx.
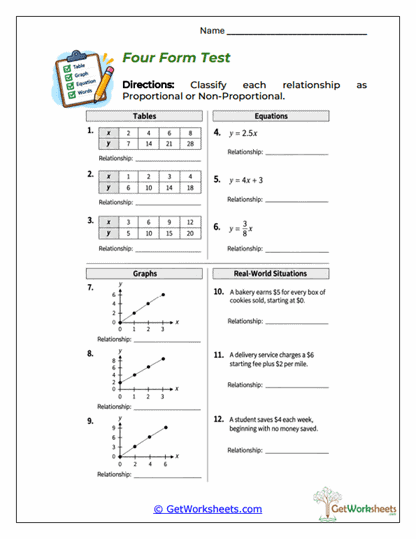
Four Form Test
Tables, equations, graphs, and contextual situations are combined into one cumulative classification activity. Students apply the appropriate test to each representation: constant y/x for tables, y = kx for equations, passage through the origin for graphs, and a zero starting amount for real-world scenarios. Moving among all four forms reveals whether students understand the concept broadly rather than only in one format. The worksheet works especially well as an end-of-topic review.
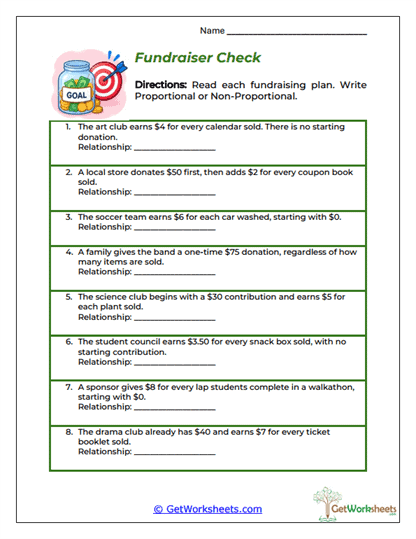
Fundraiser Check
Fundraising plans help students examine the difference between earning at a constant rate and beginning with an initial contribution. A plan that earns a fixed amount per item from a starting value of zero is proportional, while an upfront donation creates a non-proportional relationship. Students must interpret both the rate and the starting amount from each scenario. The money context gives the zero-start requirement a clear practical meaning.
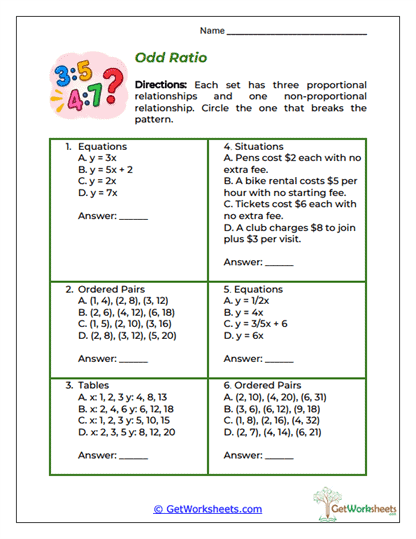
Odd Ratio
Each problem contains several relationships, with one non-proportional example hidden among proportional ones. Equations, tables, ordered pairs, and situations may all appear within the activity, forcing students to select the correct test for each representation. The odd-one-out format encourages comparison and error detection rather than isolated classification. It also strengthens students' ability to transfer proportional reasoning from one form to another.
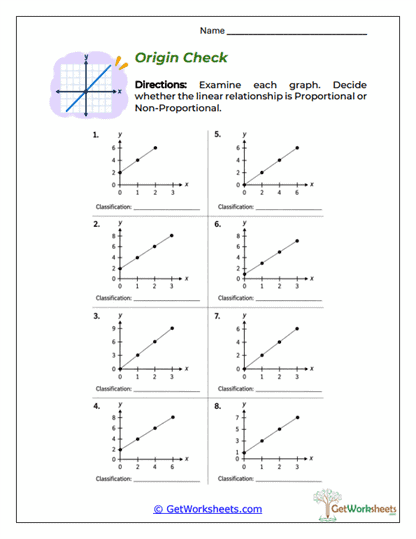
Origin Check
Graphs are classified by examining whether their lines pass through the origin. Students identify (0,0) and use that point as visual evidence for proportionality. A line that misses the origin represents a nonzero starting value and is therefore non-proportional. This activity makes the graphical meaning of proportional relationships clear and prepares students to connect y-intercepts with equations.
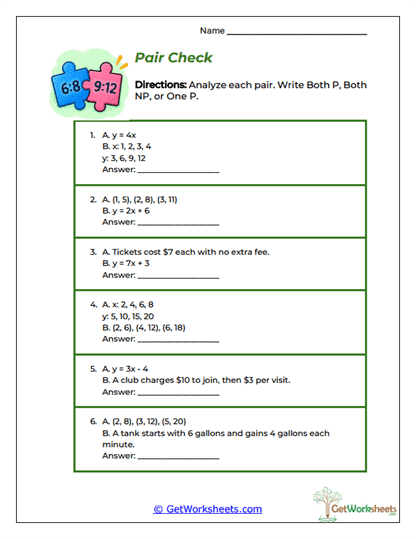
Pair Check
Two relationships are presented side by side and classified independently before students compare their results. Depending on the pair, both may be proportional, both may be non-proportional, or only one may qualify. Because the relationships can appear in different formats, students must resist treating the pair as one problem and instead analyze each representation on its own terms. The structure builds organized comparison skills and flexible reasoning.
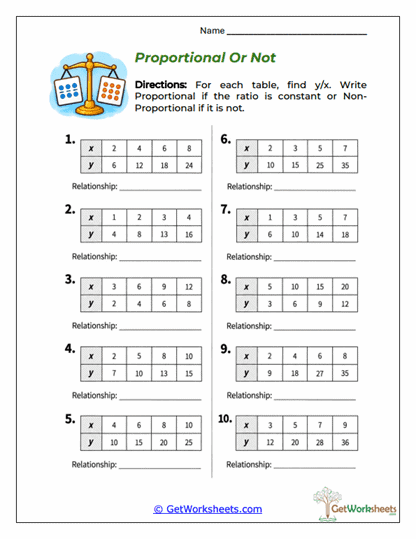
Proportional Or Not
Students examine x-y tables and determine whether y/x remains constant across every pair. If the quotient stays unchanged, the relationship is classified as proportional; if even one pair breaks the pattern, it is not. The repeated table format makes the constant multiplicative relationship visible through calculation. This worksheet establishes one of the most important numerical tests for proportionality.
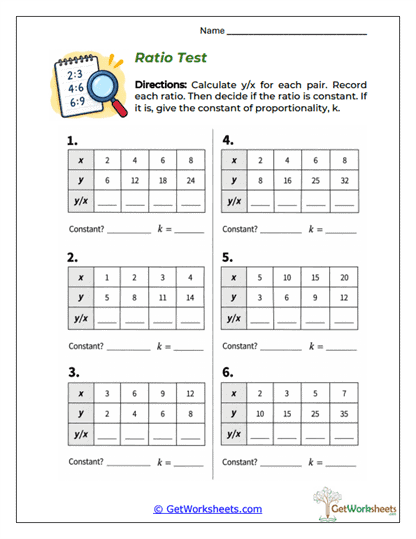
Ratio Test
Tables are analyzed in greater depth by having students record y/x for each ordered pair and identify the value of k when the relationship is proportional. The extra calculation step shows exactly where the constant of proportionality comes from. Students can then connect that repeated ratio with an equation such as y = kx. The activity provides a direct bridge from numerical data to algebraic representation.
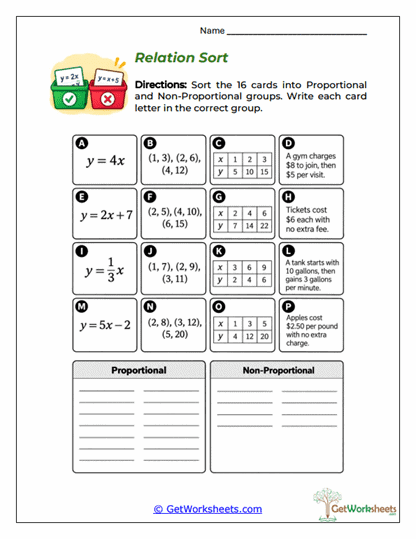
Relation Sort
A mixed set of cards representing equations, tables, ordered pairs, and real-world situations must be sorted into proportional and non-proportional groups. Because each representation offers different clues, students must choose an appropriate method rather than follow one routine. Sorting makes the similarities among proportional relationships easier to notice across formats. This worksheet is particularly useful for broad review and diagnosing which representations remain difficult.
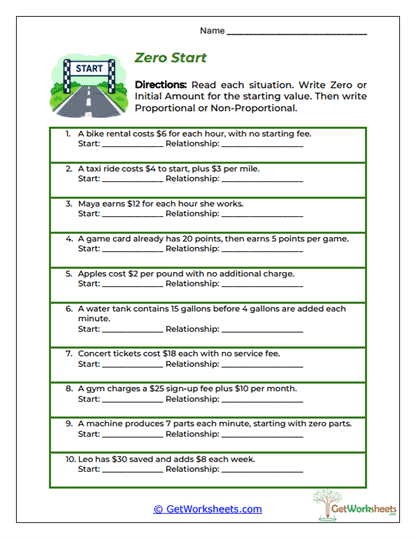
Zero Start
Real-world descriptions are analyzed according to what happens when the input is zero. Students distinguish situations that begin with no output from those containing a starting fee, initial balance, or other fixed amount. This simple question helps learners understand why a constant rate can still be non-proportional if the relationship does not pass through zero. The activity gives the idea of a y-intercept a practical foundation.
Bookmark Us Now!
New, high-quality worksheets are added every week! Do not miss out!