Poll Percentages
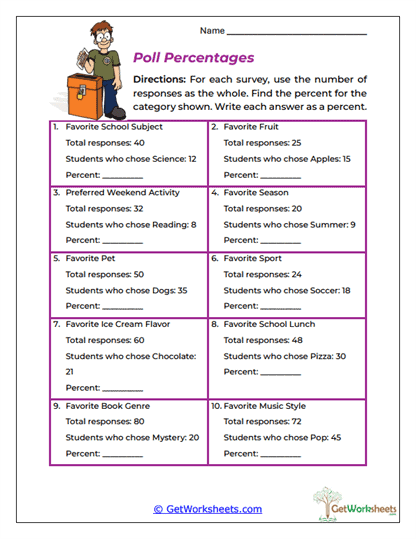
This worksheet puts percent skills into a survey setting where students figure out what percentage of a group chose a particular answer. Each problem gives the total number of responses and the number of people who selected one category, such as favorite school subject, fruit, weekend activity, season, pet, sport, ice cream flavor, lunch, book genre, or music style. Students divide the number who chose the category by the total number surveyed and convert that result into a percent. The activity strengthens part-whole relationships, division, fractions, decimals, percentages, data interpretation, and number sense while showing students exactly how percentages are used to summarize polls and surveys. It is especially useful for grades 5-6 students who can calculate percentages but need practice recognizing the part and whole inside realistic data.
Learning Goals
- Identify Survey Parts and Wholes: Students recognize the selected responses as the part and all responses as the whole.
- Calculate Survey Percentages: Learners use part ÷ whole × 100 to determine what percent of the group chose each option.
- Interpret Data Meaningfully: Students connect the final percentage with what it says about the surveyed group.
- Build Fraction-Percent Connections: Relationships such as 12 out of 40 or 35 out of 50 can be viewed as fractions before being converted to percents.
Classroom & Home Use
- Easy for Parents to Explain: Ask, “How many people chose this answer, and how many people answered the survey altogether?”
- Connects Math to Real Data: Polls, surveys, ratings, and preference studies use this exact kind of percentage calculation.
- Invites Extra Conversation: Students can compare results and discuss which choices were more or less popular.
- Great for Data Lessons: The worksheet pairs nicely with graphing, tables, and student-created classroom surveys.
- Flexible Practice: It works well for homework, centers, independent work, small groups, or homeschool lessons.
The useful lesson here is that a survey percentage tells us how large one group is compared with everyone who participated. Percents, part-whole relationships, fractions, division, data, comparison, and number sense all work together as students calculate each result. For parents, a problem such as 35 students choosing dogs out of 50 responses can be explained as 35 ÷ 50 = 0.70, or 70%. That percentage makes the survey easier to compare with another survey that may have a completely different number of participants. In classroom and homeschool settings, this worksheet builds practical percent fluency while also helping students understand how percentages are used to communicate real data.
Bookmark Us Now!
New, high-quality worksheets are added every week! Do not miss out!