Snack Shop
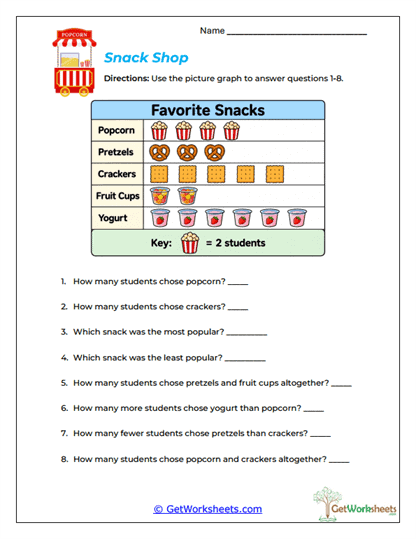
The Snack Shop Worksheet helps students read a picture graph and use its data to answer several different kinds of questions. Students study favorite snack choices, use a key showing that each symbol represents two students, and then find totals, identify the most and least popular categories, combine categories, and calculate how many more or fewer students chose one snack than another. This is a strong 2nd and 3rd grade graphing activity because students must remember to multiply the number of pictures by the value in the key rather than simply counting each symbol as one. The worksheet strengthens pictograph interpretation, multiplication by two, addition, subtraction, comparison, category totals, key reading, and mathematical reasoning.
Targeted Skills
- Use a Picture Graph Key: Students understand that each snack symbol represents two students and use that value when finding totals.
- Compare Categories: Learners identify which snack has the greatest or smallest number of student choices.
- Find Differences: Students subtract category totals to determine how many more or fewer students selected one snack.
- Combine Graph Data: Learners add values from two categories to find an overall total.
Learning Benefits
- Moves Beyond Simple Counting: Students must interpret the key before answering, which develops stronger graph comprehension.
- Combines Graphing and Arithmetic: Addition, subtraction, comparison, and early multiplication are practiced through pictograph data.
- Real-World Context: Favorite snacks make the data easy for young students to understand and discuss.
- Flexible Practice: Works well for classwork, homework, math centers, small groups, tutoring, or homeschool instruction.
Reading a scaled picture graph requires students to think carefully about what each symbol actually means. This worksheet reinforces picture graphs, keys, scales, categories, totals, addition, subtraction, comparison, and data interpretation through a familiar snack-shop theme. Students build confidence as they learn that counting the symbols is only the first step and that the key determines the true value represented by each picture. In classroom and homeschool settings, this activity develops graphing fluency, number sense, problem-solving, and mathematical reasoning. Mastering these skills prepares students for more challenging pictographs, bar graphs, scaled data displays, and multi-step graphing problems.
Bookmark Us Now!
New, high-quality worksheets are added every week! Do not miss out!