Trail Elevation
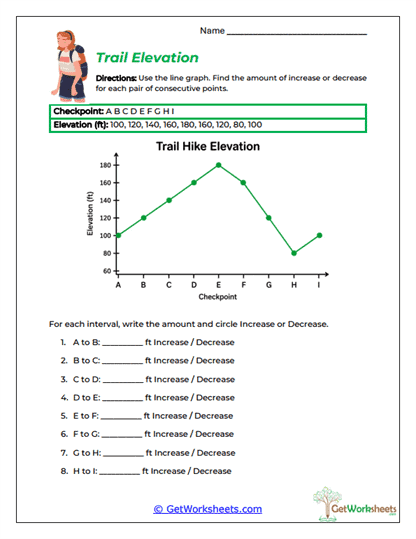
The Trail Elevation Worksheet gives students practice reading a line graph and measuring how much a value changes from one point to the next. Students study the elevation at several trail checkpoints, compare each pair of consecutive data points, and determine both the amount of change and whether the elevation increased or decreased. This is a strong 4th and 5th grade graphing activity because students must do more than identify whether the line moves up or down-they also have to calculate the numerical difference between the two values. The worksheet reinforces line graph interpretation, subtraction, change over time, increase, decrease, data comparison, elevation, intervals, and careful reading of graph scales.
Key Learning Objectives
- Measure Change Between Points: Students subtract consecutive elevation values to determine how many feet the trail rises or falls.
- Identify Increase or Decrease: Learners connect an upward line with an increase and a downward line with a decrease.
- Read Data from a Scale: Students use the vertical axis carefully to determine the elevation at each checkpoint.
- Compare Consecutive Values: The activity helps students understand how line graphs show change from one interval to the next.
Instructional Support
- Combines Graphing and Arithmetic: Students use subtraction skills while interpreting a visual data display.
- Real-World Context: Trail elevation makes increases and decreases easy to picture and discuss.
- Useful for Skill Building: Works well after students understand basic line graph reading and are ready to calculate change.
- Print-and-Go Practice: Suitable for classwork, homework, tutoring, intervention, math centers, or homeschool lessons.
Calculating how much a graph rises or falls helps students understand that line graphs show both direction and amount of change. This worksheet reinforces elevation, increase, decrease, subtraction, data points, graph scales, intervals, and line graph interpretation through repeated comparisons. Students develop stronger reasoning because they must read the values, calculate the difference, and then describe the type of change. In classroom and homeschool settings, this practice supports graphing fluency, subtraction accuracy, data analysis, and mathematical vocabulary. It also prepares students for more advanced work with rates of change, real-world measurement, and interpreting how quantities change across time or distance.
Bookmark Us Now!
New, high-quality worksheets are added every week! Do not miss out!