Team Stat Clash
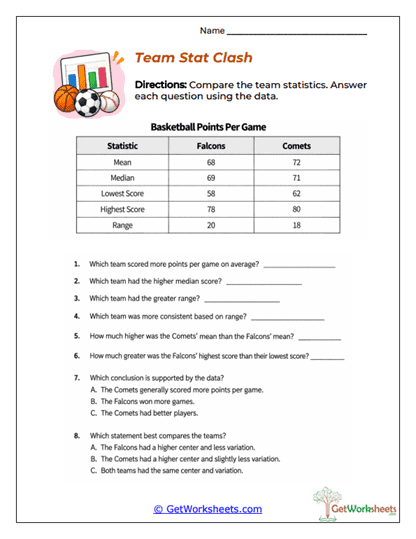
Sports statistics provide a meaningful way for students to explore how numerical measures can describe and compare group performance. This engaging printable for Grades 5-7 presents a basketball statistics table comparing two teams, the Falcons and the Comets, using their mean scores, median scores, lowest scores, highest scores, and ranges. Students answer eight questions requiring them to interpret measures of center, calculate score differences, compare variability, and determine which conclusions are supported by the statistical summaries. Through these comparisons, learners strengthen data analysis, numerical reasoning, measures of central tendency, range interpretation, and their understanding of consistency within numerical distributions.
Academic Focus
-
Comparing Measures of Center: Interpret mean and median values to determine how the teams’ typical scoring performances differ.
-
Analyzing Statistical Range: Examine the difference between highest and lowest scores to understand variations in team performance.
-
Performing Numerical Comparisons: Apply subtraction to calculate differences between team averages and individual statistical values.
-
Evaluating Statistical Conclusions: Use measures of center and spread to determine which team generally scores higher and which demonstrates greater consistency.
Classroom & Home Use
-
Realistic Sports Application: Basketball scoring data provides an engaging context for understanding statistical summaries.
-
Eight Focused Questions: Combines numerical calculations, interpretation, and multiple-choice reasoning to assess different levels of understanding.
-
Comparative Data Table: Side-by-side statistics allow students to identify relationships without constructing calculations from an entire raw data set.
-
Mathematical Discussion: Encourages explanations about why higher averages and smaller ranges communicate different aspects of performance.
-
Flexible Learning Resource: Suitable for statistics lessons, independent assignments, assessment, small-group instruction, and homeschool practice.
Comparing numerical summaries helps students recognize that one statistical measure rarely tells the complete story about a data set. By examining mean scores, median values, maximum and minimum results, numerical ranges, and performance consistency, learners develop stronger analytical reasoning and statistical comprehension. Teachers can use this activity to demonstrate how measures of center describe typical performance while measures of spread reveal variation among observations. This printable strengthens mathematical fluency, critical thinking, data interpretation, and evidence-based decision-making while preparing students to compare more complex distributions and evaluate statistical information in everyday situations.
Bookmark Us Now!
New, high-quality worksheets are added every week! Do not miss out!