Expected or Observed
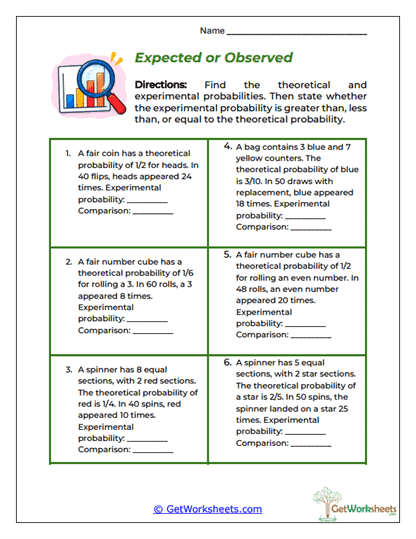
Distinguishing between mathematical expectations and experimental observations helps students develop a more complete understanding of probability and random variation. Designed for Grades 5-7, this analytical printable presents six word problems involving fair coins, standard number cubes, colored spinners, and bags containing different colored counters. Each scenario provides a theoretical probability and the results of an actual experiment, requiring learners to calculate the experimental probability and determine whether it is greater than, less than, or equal to the theoretical value. The exercises reinforce theoretical probability, experimental probability, fractional comparisons, frequency analysis, numerical reasoning, and the important distinction between predicted likelihood and observed outcomes.
Key Learning Objectives
-
Understanding Theoretical Probability: Recognize that theoretical probability describes the expected likelihood of an event based on its possible outcomes.
-
Calculating Experimental Probability: Use recorded frequencies and total trials to express observed results as simplified fractions.
-
Comparing Probability Values: Determine whether the experimental probability is greater than, less than, or equal to the theoretical probability.
-
Interpreting Random Variation: Understand why actual experimental results may differ from mathematically predicted probabilities.
Educational Value
-
Six Comparative Scenarios: Provides targeted practice evaluating theoretical and experimental probabilities across familiar random experiments.
-
Fraction Comparison Practice: Reinforces equivalent fractions, simplifying fractions, and comparing fractional values.
-
Scientific Reasoning Connections: Introduces important ideas about predictions, observations, repeated trials, and variability in experimental results.
-
Conceptual Statistics Development: Encourages students to understand the meaning of probability calculations rather than simply applying formulas.
-
Versatile Instruction: Appropriate for classroom investigations, partner discussions, independent assignments, math centers, and homeschool activities.
Comparing expected and observed probabilities helps learners recognize that random events can produce results that differ from their theoretical likelihoods. Through experimental frequency calculations, fractional comparisons, numerical analysis, and statistical interpretation, students develop stronger mathematical fluency and reasoning skills. Teachers can extend the activity by asking students to explain why a probability of one-half does not guarantee that exactly half of a limited number of trials will produce the desired outcome. This printable strengthens analytical confidence, proportional reasoning, data literacy, and mathematical communication while preparing students to investigate simulations, experimental variation, and the relationship between theoretical models and actual observations.
Bookmark Us Now!
New, high-quality worksheets are added every week! Do not miss out!