Data Shift
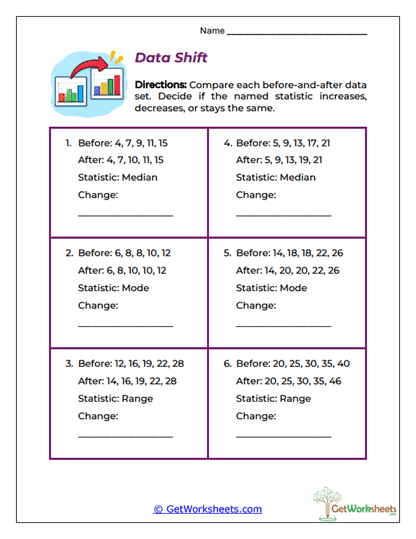
Understanding how a numerical distribution changes when individual values are modified helps students develop more advanced statistical reasoning. Designed for Grades 5-7, this analytical printable presents six paired data sets showing the values before and after a numerical change. Students examine the original and revised observations, calculate the specified statistic, and determine whether the median, mode, or range increases, decreases, or remains unchanged. The activity reinforces data comparisons, measures of central tendency, numerical variability, frequency analysis, mathematical reasoning, and an understanding of how changes in individual observations influence statistical summaries.
Targeted Skills
-
Comparing Median Values: Determine whether changes to individual observations affect the middle value of an ordered data set.
-
Analyzing Mode Changes: Examine how modifying repeated numbers influences which value occurs most frequently.
-
Evaluating Range Differences: Identify how changes to minimum or maximum values affect the numerical spread.
-
Recognizing Statistical Stability: Understand that modifying a data value does not necessarily change every statistical measure.
Teaching Advantages
-
Six Before-and-After Investigations: Provides meaningful opportunities to compare original and modified numerical distributions.
-
Conceptual Understanding: Encourages students to investigate why a statistical measure changes or remains constant.
-
Higher-Order Mathematical Thinking: Moves beyond calculating statistics by requiring comparisons, predictions, and interpretation.
-
Visual Organization: Paired data sets make it easier to locate modified observations and examine their effects.
-
Instructional Flexibility: Appropriate for guided discovery, partner discussions, enrichment activities, independent assignments, and homeschool learning.
Exploring changes in statistical measures helps students understand the relationships between individual observations and the overall characteristics of numerical data. Through median comparisons, frequency evaluations, range calculations, and distribution analysis, learners develop stronger analytical skills and mathematical confidence. Teachers can extend the activity by asking students to predict the effect of a numerical change before calculating the revised statistic, then explain whether their prediction was correct. This print-and-go resource strengthens statistical comprehension, logical reasoning, data interpretation, and mathematical communication while preparing learners to investigate outliers, variability, changing distributions, and more advanced statistical concepts.
Bookmark Us Now!
New, high-quality worksheets are added every week! Do not miss out!