Data Skills Check
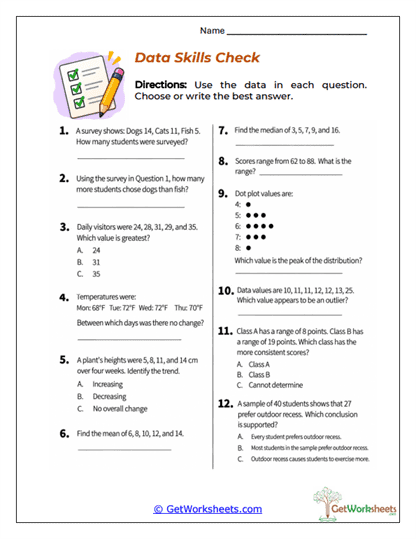
A comprehensive understanding of statistics requires students to interpret numerical information, recognize data patterns, and apply appropriate mathematical reasoning. Designed for Grades 5-7, this printable review activity presents twelve questions covering survey frequencies, numerical comparisons, mean, median, range, line graph trends, dot plot distributions, outliers, and variability. Students work through a combination of short-answer and multiple-choice exercises involving pets, daily visitors, temperatures, plant growth, test scores, classroom results, and recess preferences. The varied questions reinforce statistical vocabulary, measures of center, data interpretation, arithmetic reasoning, distribution analysis, and the ability to determine which conclusions are supported by numerical evidence.
Skills Reinforced
-
Interpreting Categorical Data: Analyze survey results, compare category frequencies, and calculate totals and numerical differences.
-
Calculating Statistical Measures: Determine mean, median, and range while understanding how each measure describes a numerical data set.
-
Recognizing Data Patterns: Identify increasing or decreasing trends, unchanged values, outliers, and the most frequent value in a dot plot.
-
Evaluating Statistical Reasoning: Compare distributions, consider variability, and identify conclusions supported by recorded information.
Instructional Support
-
Twelve Comprehensive Questions: Covers multiple foundational statistics concepts in one organized review activity.
-
Varied Response Formats: Combines written calculations, short explanations, and multiple-choice questions to assess different mathematical abilities.
-
Diagnostic Assessment: Helps teachers recognize strengths and identify concepts requiring additional instruction or reinforcement.
-
Real-World Applications: Uses familiar situations to demonstrate how statistics supports everyday observations and decisions.
-
Print-and-Go Convenience: Suitable for end-of-unit reviews, classroom quizzes, homework, independent practice, and homeschool assessments.
Reviewing statistical concepts together helps students recognize connections between data collection, numerical summaries, graphical representations, and mathematical conclusions. Through frequency comparisons, mean and median calculations, range analysis, dot plot interpretation, outlier recognition, and evidence-based reasoning, learners strengthen essential mathematical fluency and comprehension. Teachers can use the results to evaluate understanding, address misconceptions, and plan targeted practice before introducing more advanced statistical topics. This comprehensive printable builds confidence, accuracy, critical thinking, and independent problem-solving skills while reinforcing the foundational knowledge students need for continued success in statistics, probability, and data analysis.
Bookmark Us Now!
New, high-quality worksheets are added every week! Do not miss out!