Evidence Check
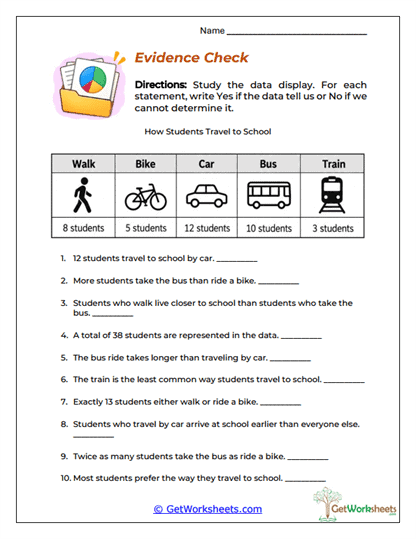
Not every statement about a data set can be confirmed simply because the information appears in a chart or table. This thought-provoking statistics activity helps students in Grades 4-6 examine how classmates travel to school and decide whether different statements are supported, contradicted, or cannot be determined from the available evidence. Using a transportation table featuring walking, biking, traveling by car, riding the bus, and taking the train, learners evaluate ten statements about student counts, category comparisons, travel times, and personal circumstances. The exercises strengthen data interpretation, evidence-based reasoning, categorical comparisons, statistical literacy, and the important distinction between factual observations and unsupported assumptions.
Academic Focus
- Recognizing Supported Statements: Determine whether a claim accurately reflects the numerical information provided in the transportation data.
- Identifying Contradictory Evidence: Compare actual category frequencies with statements that incorrectly describe the recorded results.
- Recognizing Insufficient Information: Understand why conclusions about travel duration, distance, or arrival times cannot be established from transportation counts alone.
- Applying Mathematical Reasoning: Use addition, comparisons, and numerical relationships to evaluate claims about the student population.
Classroom & Home Use
- Ten Evidence-Based Questions: Provides meaningful practice with factual verification, unsupported conclusions, and numerical comparisons.
- Three-Way Classification: Yes, No, and Cannot Determine responses encourage greater precision than simple true-or-false exercises.
- Critical Thinking Opportunities: Supports classroom discussions about what data can reveal and what additional information might be needed.
- Real-Life Relevance: School transportation offers a familiar setting for exploring the limitations of statistical information.
- Flexible Teaching Resource: Appropriate for guided instruction, partner discussions, independent assessments, and homeschool activities.
Understanding the difference between evidence and assumption is an important foundation for responsible statistical interpretation. Students strengthen analytical thinking, frequency comparisons, data comprehension, logical reasoning, and mathematical communication as they evaluate each statement. Teachers can extend the activity by asking learners what additional information would be necessary to answer questions that cannot be determined from the table. This printable encourages careful observation, confident reasoning, and responsible conclusions while preparing students to analyze surveys, graphs, statistical claims, and everyday information more critically.
Bookmark Us Now!
New, high-quality worksheets are added every week! Do not miss out!