Score Sort
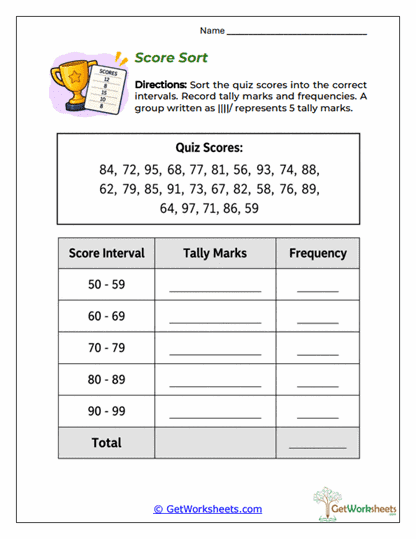
This Score Sort Worksheet helps students in Grades 4-6 develop intermediate statistics skills by organizing numerical quiz scores into a grouped frequency distribution. Students examine a collection of 24 quiz scores and sort the values into five designated score intervals ranging from 50-59 through 90-99. For each interval, learners record tally marks, calculate the frequency, and determine the overall total while practicing numerical classification and data organization. The activity introduces grouped frequency tables, class intervals, tally notation, frequency counting, score distributions, and statistical verification in an academic assessment context.
Learning Goals
-
Understanding Class Intervals: Recognize how numerical ranges organize individual observations into meaningful groups.
-
Sorting Numerical Data: Assign each quiz score to the appropriate interval based on its value.
-
Recording Grouped Frequencies: Use tally marks and frequency counts to summarize the number of scores within each range.
-
Verifying Distribution Totals: Add interval frequencies and compare the result with the original number of scores.
Classroom & Home Use
-
Authentic Data Context: Quiz scores provide a familiar example of how grouped frequency distributions are used.
-
Progressive Statistics Practice: Extends students’ understanding from individual-value frequency tables to grouped numerical intervals.
-
Organized Layout: A prepared table keeps attention on score classification, tally counting, and accurate frequency recording.
-
Instructional Flexibility: Works well for guided lessons, independent assignments, formative assessments, and homeschool statistics practice.
This printable grouped frequency table worksheet strengthens students’ ability to transform unsorted numerical data into an organized statistical summary. By classifying quiz scores, recording tally marks, counting interval frequencies, and verifying totals, learners develop greater confidence in numerical analysis and mathematical reasoning. Teachers can use the activity to introduce frequency distributions with class intervals and emphasize the importance of assigning every data value to the correct range. These foundational skills prepare students to interpret histograms, examine score patterns, compare numerical distributions, and understand more advanced statistical representations.
Bookmark Us Now!
New, high-quality worksheets are added every week! Do not miss out!