Survey Scoop
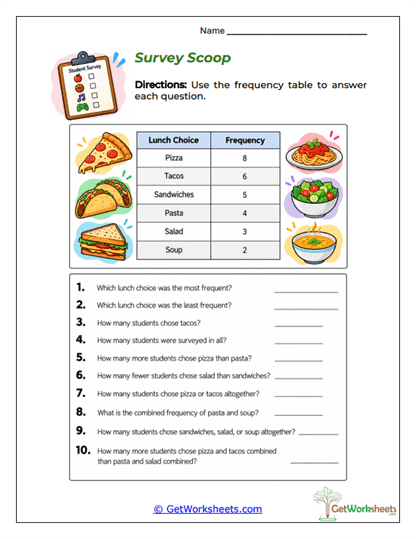
This Survey Scoop Worksheet helps students in Grades 3-4 develop essential statistics and data interpretation skills through a familiar lunch preference survey. Students examine a completed frequency table showing how many students selected pizza, tacos, sandwiches, pasta, salad, or soup as their preferred lunch choice. Using the recorded frequencies, learners answer ten questions involving category comparisons, greatest and least values, combined totals, and numerical differences. The activity reinforces frequency table reading, categorical data analysis, addition, subtraction, survey interpretation, and mathematical problem-solving within an accessible real-world context.
Targeted Skills
-
Reading Frequency Tables: Locate and interpret numerical frequencies associated with specific survey categories.
-
Comparing Data Values: Identify the most and least popular choices and determine differences between category frequencies.
-
Combining Frequencies: Apply addition to calculate totals for multiple categories and the complete survey.
-
Answering Statistical Questions: Use information from a frequency table to support accurate numerical conclusions.
Learning Benefits
-
Ten Comprehension Questions: Provides varied opportunities to practice locating, comparing, and combining frequency data.
-
Real-World Connection: A school lunch survey makes statistical information familiar and meaningful to elementary students.
-
Progressive Reasoning: Questions move from straightforward data identification to more involved calculations and comparisons.
-
Flexible Learning: Suitable for classroom instruction, independent practice, homework, assessment, and homeschool activities.
This printable frequency table worksheet helps students recognize how organized survey results can answer meaningful mathematical questions. Through data comparisons, frequency calculations, category analysis, and total verification, learners strengthen number sense, statistical comprehension, and arithmetic reasoning. Teachers can use the activity to introduce data-based questioning, reinforce addition and subtraction skills, or assess students’ ability to interpret categorical frequency distributions. Regular practice with survey tables builds confidence and fluency while preparing students to analyze bar graphs, interpret statistical summaries, and make evidence-based observations about collected data.
Bookmark Us Now!
New, high-quality worksheets are added every week! Do not miss out!