Visual Ratios
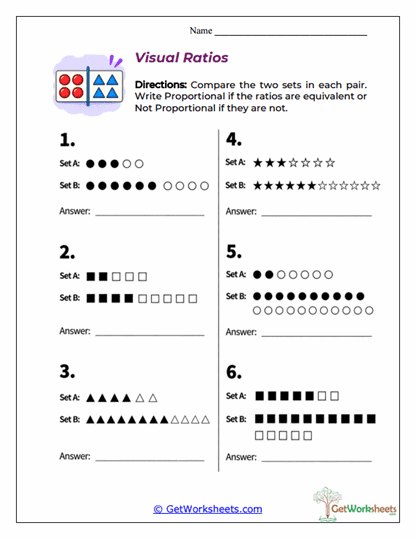
This worksheet gives students a visual way to decide whether two sets represent the same ratio relationship. Each problem shows Set A and Set B using shapes such as circles, squares, triangles, or stars. Students compare the number of filled and unfilled shapes in each set, then decide whether the two ratios are proportional. This is especially helpful for visual learners because students can literally see the quantities before turning them into numbers.
For a parent, the first step is to count the two types of shapes in Set A and write that as a ratio. Then do the same for Set B. If the two ratios are equivalent, the answer is Proportion. If they are not equivalent, the answer is Not Proportional.
For example, if Set A shows 3 filled circles and 2 empty circles, the ratio is 3:2. If Set B shows 6 filled circles and 4 empty circles, the ratio is 6:4. Since 6:4 simplifies to 3:2, the two sets are proportional.
Learning Goals
- Turn Visuals into Ratios: Students count two groups and write the relationship numerically.
- Compare Visual Ratios: Learners determine whether two picture sets are equivalent.
- Simplify Ratios: Students reduce larger visual ratios when needed.
- Use Scale Factors: Learners recognize when both groups were enlarged by the same factor.
- Connect Concrete Models to Abstract Math: Students move from pictures to ratio and proportion reasoning.
Parent-Friendly Teaching Tips
Use this routine:
- Count the first type of shape in Set A.
- Count the second type.
- Write that ratio.
- Repeat for Set B.
- Simplify or compare the two ratios.
- Decide whether they are proportional.
For example:
Set A: 3 filled, 2 empty
Ratio = 3:2
Set B: 9 filled, 6 empty
Ratio = 9:6
Divide both parts of 9:6 by 3:
3:2
So the sets form a Proportion.
Why This Worksheet Helps
- Makes Ratios Concrete: Students can see and count the quantities.
- Supports Visual Learners: Picture models make proportional relationships easier to understand.
- Builds a Bridge to Abstract Notation: Learners move from shapes to numbers and ratio statements.
- Strengthens Simplification: Larger visual ratios often need to be reduced.
- Encourages Careful Counting: Students must identify both groups accurately before comparing.
The real value of this worksheet is that it shows students that ratios are not just numbers on a page-they describe relationships between actual groups. Counting, visual models, simplification, equivalent ratios, and proportional reasoning all work together. For parents, the best question is: “What is the ratio in each picture, and do those two ratios reduce to the same relationship?”
Bookmark Us Now!
New, high-quality worksheets are added every week! Do not miss out!