Percent Grid
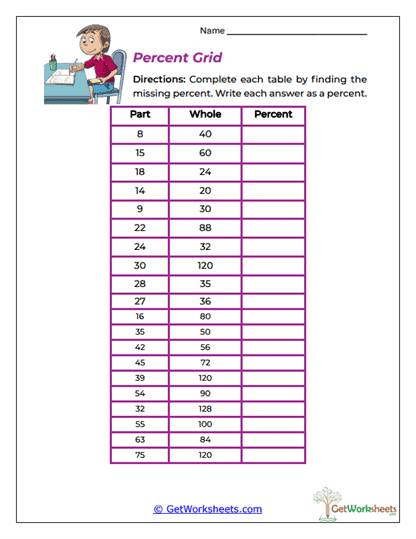
This worksheet organizes percent practice into a simple table where students are given the part and whole and must find the missing percent for each row. The chart format includes many different relationships, such as 8 out of 40, 15 out of 60, 22 out of 88, 35 out of 50, and 75 out of 120, giving students repeated opportunities to use part ÷ whole × 100 without distractions. The activity strengthens percent calculation, division, decimal conversion, fraction sense, table reading, number sense, and mathematical organization while helping students see patterns across many examples. It is especially useful for grades 5-6 students who benefit from a clean, structured format and need repeated practice finding percentages from raw data.
Key Learning Objectives
- Use the Percent Formula Repeatedly: Students apply the same part-and-whole relationship across many rows.
- Read Data from a Table: Learners practice locating the correct values in the Part and Whole columns before calculating.
- Convert Quotients to Percents: Students turn division results into percentages using multiplication by 100.
- Notice Number Patterns: Values such as 8/40, 15/60, and 24/32 help students recognize familiar fraction-percent relationships.
Educational Value
- Great for Students Who Like Structure: The table keeps the part, whole, and percent clearly separated.
- Parent-Friendly Routine: Adults can simply move across the row: “Here is the part, here is the total, now what percent is that?”
- Builds Fluency Through Repetition: The consistent setup helps students become faster without changing the core skill.
- Useful for Quick Assessment: Teachers can easily see whether students understand the formula or are confusing the part and whole.
- Flexible Practice: The worksheet works well for homework, centers, review, intervention, or homeschool instruction.
This worksheet helps students develop a steady routine for finding percentages while also getting more comfortable reading mathematical tables. Percent, part, whole, division, decimal conversion, fractions, and number sense all work together as students complete each row. For parents, the chart makes the process easier to follow because the child can clearly see which number is the amount being counted and which number is the total. A row like 35 out of 50 becomes 35 ÷ 50 = 0.70, or 70%. In classroom and homeschool settings, this activity builds accuracy, speed, and confidence with one of the most common percent calculations students will use later.
Bookmark Us Now!
New, high-quality worksheets are added every week! Do not miss out!