Percentage Breakdown Match
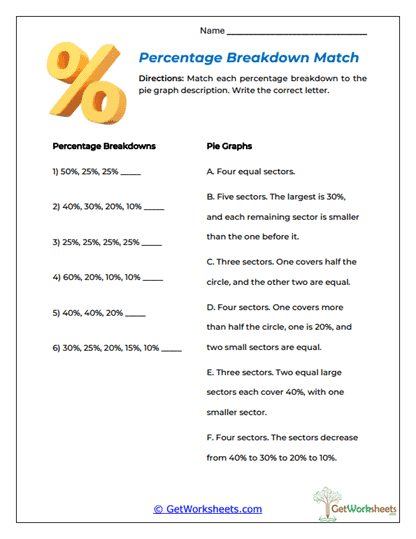
The Percentage Breakdown Match Worksheet helps students visualize how different sets of percentages would divide a pie graph into sectors. Students read percentage combinations such as 50%, 25%, 25% or 40%, 30%, 20%, 10%, then match each breakdown to the correct written description of what the pie graph would look like. This is a useful upper elementary and middle school graphing activity because students must understand relative sector size without relying on exact drawings. The worksheet strengthens percentage comparison, part-to-whole reasoning, sector size estimation, equivalent visual proportions, data representation, and pie graph interpretation.
Key Learning Objectives
- Compare Percentage Sizes: Students determine which percentages would produce larger or smaller sectors.
- Visualize the Whole: Learners mentally picture how several percentages fit together inside one complete circle.
- Match Data to Descriptions: Students connect numerical percentage sets to verbal descriptions of sector sizes.
- Recognize Equal Portions: The activity reinforces the idea that equal percentages create equal sectors.
Classroom & Home Use
- Builds Visual Percent Sense: Students learn to imagine what 50%, 25%, 20%, and other common values should look like.
- Supports Pie Graph Construction: Understanding relative sector size prepares learners to draw more accurate circular graphs later.
- Encourages Careful Comparison: Students must examine every value in the set before choosing a match.
- Print-and-Go Practice: Suitable for classwork, homework, math centers, tutoring, review, or homeschool instruction.
Understanding how percentages translate into sector sizes helps students read pie graphs more accurately. This worksheet reinforces percentages, sectors, proportions, equal parts, part-to-whole relationships, comparison, and visual estimation through a matching format. Students gain confidence because they begin to recognize common percentage patterns and how those values should look when divided into a circle. In classroom and homeschool settings, this activity supports percentage sense, graph interpretation, spatial reasoning, and mathematical communication. These skills also prepare students for sector-angle work, pie chart construction, and more advanced proportional reasoning.
Bookmark Us Now!
New, high-quality worksheets are added every week! Do not miss out!