School Supply Graph
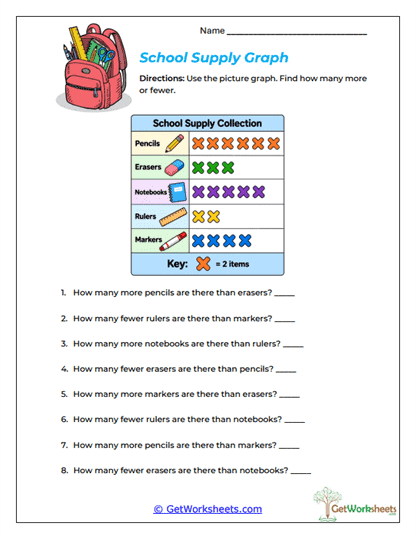
The School Supply Graph Worksheet helps students compare category totals on a scaled picture graph and determine how many more or fewer items one category has than another. Students study school supply data, use a key showing that each symbol represents two items, and answer comparison questions involving pencils, erasers, notebooks, rulers, and markers. This is a useful 2nd and 3rd grade graphing activity because students must first interpret the symbol scale and then use subtraction to find the difference between categories. The worksheet strengthens pictograph reading, scaled counting, subtraction, comparison language, category totals, key interpretation, and data reasoning.
Key Learning Objectives
- Compare Category Totals: Students determine which category has more or fewer items.
- Find Numerical Differences: Learners subtract totals to calculate exactly how many more or fewer items are represented.
- Use the Key Correctly: Students remember that each symbol stands for two items before finding any difference.
- Interpret Comparison Language: Terms such as more, fewer, and difference become connected to actual graph data.
Instructional Support
- Combines Graphing and Subtraction: Students practice arithmetic in a meaningful data context.
- Builds Careful Reading: Learners must pay attention to both the category names and the wording of each comparison question.
- Helpful for Skill Checks: Teachers and parents can quickly see whether students understand the key and can compare scaled totals accurately.
- Low-Prep Resource: Works well for independent work, homework, tutoring, intervention, math centers, or homeschool lessons.
Comparing categories on a pictograph helps students use graphs to answer practical questions instead of simply counting symbols. This worksheet reinforces picture graphs, scales, keys, subtraction, more than, fewer than, category totals, and data comparison through a familiar school-supply theme. Students build stronger number sense as they connect visual differences in the graph with numerical differences in the totals. In classroom and homeschool settings, this activity supports graph comprehension, subtraction fluency, mathematical vocabulary, and reasoning. These skills prepare students for more advanced comparison problems in bar graphs, tables, word problems, and other data displays.
Bookmark Us Now!
New, high-quality worksheets are added every week! Do not miss out!