Model Matcher
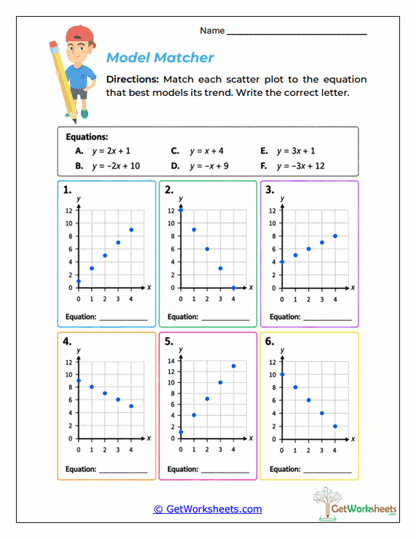
The Model Matcher Worksheet helps students connect the visual pattern of a scatter plot with the equation that best represents its trend. Students study several scatter plots and choose the most appropriate linear equation from an answer bank by comparing each graph’s direction, slope, and intercept. This is a valuable middle school graphing activity because students must interpret the shape of the data and connect it to algebraic features such as positive slope, negative slope, steepness, and starting value. The worksheet strengthens scatter plot analysis, slope comparison, y-intercepts, linear equations, line of best fit, graph-to-equation connections, correlation, and mathematical reasoning.
Key Learning Objectives
- Match Graphs to Equations: Students compare the visual trend in each scatter plot with the structure of possible linear models.
- Interpret Slope Direction: Learners use whether the data rise or fall to eliminate equations with the wrong slope sign.
- Compare Steepness: Students distinguish between larger and smaller slope values by looking at how quickly the trend changes.
- Estimate Intercepts: Learners consider where a reasonable model would begin in relation to the y-axis.
Classroom & Home Use
- Connects Visual and Algebraic Thinking: Students practice moving between graphs and equations instead of treating them as separate topics.
- Supports Slope Understanding: The answer choices give learners repeated exposure to positive and negative slope values.
- Useful for Review: Teachers and parents can use the worksheet to check whether students understand the main features of linear models.
- Low-Prep Resource: Suitable for independent work, homework, math centers, tutoring, intervention, or homeschool lessons.
Matching a scatter plot to an equation helps students understand that the numbers in a linear model describe visible features of the graph. This worksheet reinforces slope, y-intercept, linear equations, scatter plots, best-fit models, positive trends, negative trends, and graph interpretation through repeated comparison. Students become more confident as they learn to use direction, steepness, and intercept information instead of guessing from appearance alone. In classroom and homeschool settings, this activity strengthens algebra readiness, visual reasoning, data modeling, and equation fluency. These skills also prepare students for writing equations from graphs, interpreting regression models, and using linear relationships to solve real-world problems.
Bookmark Us Now!
New, high-quality worksheets are added every week! Do not miss out!