Score Predictor
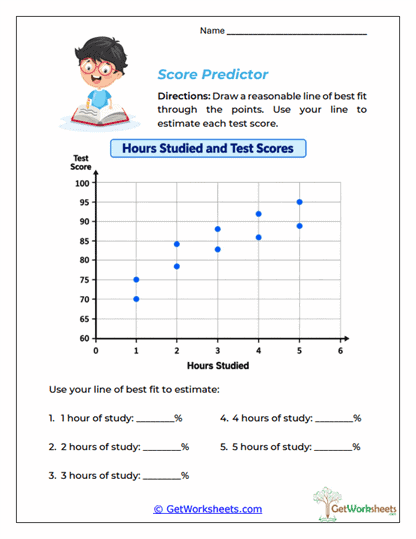
The Score Predictor Worksheet asks students to use a scatter plot showing hours studied and test scores to draw a reasonable line of best fit and then use that line to make predictions. Students first examine the relationship between study time and score, sketch a line through the center of the data, and estimate likely test scores for several different study times. This is an important middle school graphing activity because students begin using a best-fit line as a practical prediction tool instead of treating it as only a visual feature. The worksheet strengthens scatter plot interpretation, positive correlation, line of best fit construction, prediction, interpolation, estimation, data modeling, and real-world reasoning.
Key Learning Objectives
- Draw a Best-Fit Line: Students create a reasonable straight-line model that follows the center and direction of the plotted data.
- Make Predictions: Learners use the line to estimate a test score for a given number of study hours.
- Interpret Positive Association: Students recognize that the data generally show higher scores as study time increases.
- Connect Graphs to Real Situations: The activity shows how a mathematical model can be used to estimate an unknown value from an observed trend.
Classroom & Home Use
- Makes Modeling Practical: Students see a clear reason for drawing a line of best fit because they immediately use it to make predictions.
- Supports Estimation Skills: Answers do not have to match an exact plotted point, helping students understand approximate modeling.
- Good Bridge to Equations: This activity prepares students for using algebraic best-fit equations to make the same kinds of predictions.
- Easy to Assign: Suitable for guided practice, independent work, homework, tutoring, intervention, or homeschool lessons.
Using a best-fit line for prediction helps students see how scatter plots can be used to answer questions about values that are not directly shown. This worksheet reinforces positive correlation, scatter plots, line of best fit, prediction, estimation, study time, test scores, and linear modeling in a familiar context. Students develop stronger reasoning because they must use the overall trend instead of simply reading a known point. In classroom and homeschool settings, this activity builds graphing fluency, data interpretation, estimation confidence, and an early understanding of predictive modeling. It also prepares students for later work with equations of best-fit lines, interpolation, extrapolation, and regression.
Bookmark Us Now!
New, high-quality worksheets are added every week! Do not miss out!