Plant Growth Plot
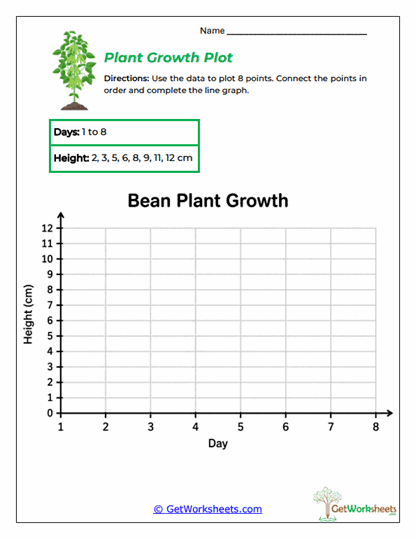
The Plant Growth Plot Worksheet asks students to take information from a small data set and turn it into a complete line graph showing how a bean plant grows over several days. Students use the provided day values and plant heights, plot eight corresponding data points, and connect the points in order to show how the plant’s height changes over time. This is an important 4th and 5th grade graphing skill because students are doing more than reading a finished graph-they must create the visual representation themselves from numerical information. The activity strengthens data plotting, line graph construction, axis reading, scale use, ordered data, measurement, trend recognition, and the relationship between tables and graphs.
Targeted Skills
- Plot Data Accurately: Students match each day with its correct plant height and place the point where those two values meet on the graph.
- Create a Line Graph: After plotting the data, students connect the points in chronological order to display change over time.
- Use Graph Scales: Learners must carefully read the numbered height scale and place values at the correct vertical position.
- Connect Data to Visuals: Students see how a list of measurements can be transformed into a graph that makes patterns easier to recognize.
Instructional Benefits
- Moves Beyond Graph Reading: Students practice actually building a graph rather than only answering questions about one that is already complete.
- Meaningful Science Connection: Plant growth provides an easy-to-understand example of how measurements can change over time.
- Supports Careful Work: Each point must be placed correctly, helping students practice accuracy, organization, and attention to scales.
- Flexible Classroom Use: Works well for guided practice, independent work, assessment, homework, tutoring, or homeschool instruction.
Creating a line graph is an important step because it shows whether students truly understand how data becomes a visual picture. This worksheet reinforces data points, line graphs, measurement, scales, days, plant height, horizontal axes, vertical axes, and change over time through a hands-on graphing task. Students learn that each point represents two connected pieces of information and that connecting those points reveals the overall growth pattern much more clearly than a list of numbers alone. The activity also builds graphing fluency, data organization, mathematical reasoning, and confidence because students create the finished graph themselves. In classroom and homeschool settings, this type of practice prepares students for later work with scientific data, tables, graph comparisons, trends, and more advanced data analysis.
Bookmark Us Now!
New, high-quality worksheets are added every week! Do not miss out!