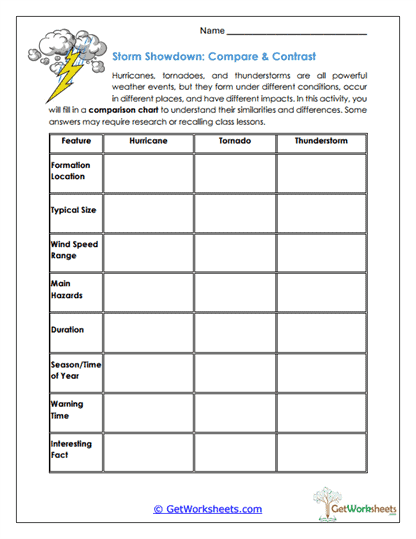
Storm Comparison Chart
This worksheet supports students in Grades 4, 5, and 6 as they build a deeper understanding of severe weather through structured comparison, organization, and synthesis of scientific information. Using a clear chart format, learners analyze hurricanes, tornadoes, and thunderstorms by examining formation location, size, hazards, duration, and shared characteristics while strengthening critical thinking and research skills.
Learning Goals
- Comparing Severe Weather Systems (Grades 4-6) – Identify similarities and differences among hurricanes, tornadoes, and thunderstorms.
- Weather Science Understanding – Explore how storms form, where they occur, and the hazards they present.
- Information Organization – Record and organize facts clearly using a comparison chart.
- Synthesis & Analysis – Combine prior knowledge and research to draw meaningful conclusions about storm behavior.
Instructional Benefits
- Teacher-Created Resource – Designed by educators to align with upper elementary Earth science and geography standards.
- Structured Chart Format – Supports visual learners and helps students organize complex information effectively.
- Research-Friendly Activity – Can be completed using textbooks, class notes, or guided research.
- Flexible Classroom Use – Ideal for classwork, homework, review lessons, science notebooks, or projects.
This printable worksheet helps students strengthen comparison skills, scientific reasoning, and understanding of severe weather patterns through organized analysis. Learners practice gathering information, synthesizing details, and explaining how different storms are both unique and related. Well suited for both classroom and homeschool settings, this no-prep activity supports meaningful learning by combining weather science, geography, and critical thinking skills.
This worksheet is part of our Weather and Climate Worksheets collection.
Bookmark Us Now!
New, high-quality worksheets are added every week! Do not miss out!