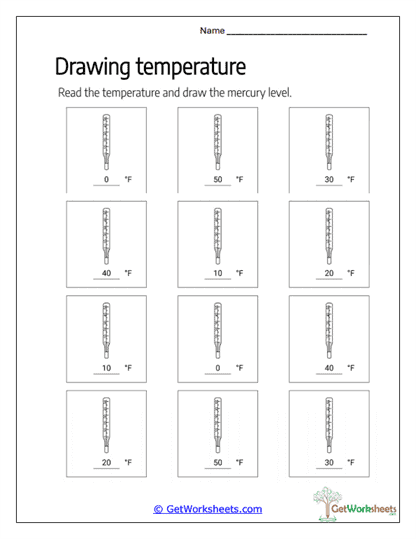
Drawing Fahrenheit Temperature
This worksheet is designed for students in Grades 3 and 4 to strengthen understanding of temperature measurement through hands-on, visual practice with the Fahrenheit scale. By interpreting numerical temperature values, recognizing scale intervals, and drawing proportional mercury levels, learners connect numerical data to accurate visual representations while building measurement confidence.
Learning Goals
- Fahrenheit Temperature Measurement (Gr. 3-4): Represent given temperature values accurately on a Fahrenheit thermometer.
- Data Visualization & Scaling: Translate numbers into proportional visual models using correct scale placement.
- Understanding Fahrenheit Scales: Reinforce knowledge of customary temperature units commonly used in the U.S.
- Visual-Spatial Reasoning: Develop precision and accuracy when illustrating quantitative information.
Instructional Benefits
- Teacher-Created Resource: Designed by educators to align with elementary math and science standards.
- Active, Hands-On Learning: Drawing tasks engage students and reinforce conceptual understanding.
- Supports Measurement Literacy: Helps students see how numbers relate to real-world measurement tools.
- Flexible Use: Ideal for science lessons, math centers, independent practice, small groups, assessment review, homework, or homeschool instruction.
This Drawing Fahrenheit Temperature worksheet helps students move beyond reading thermometers to actively modeling temperature data. By accurately illustrating mercury levels, learners strengthen scale interpretation, proportional reasoning, and confidence using Fahrenheit measurements. Whether used in the classroom or a homeschool setting, this printable provides clear, no-prep practice that supports strong foundations in temperature measurement and data visualization.
This worksheet is part of our Reading Thermometers and Temperatures collection.
Bookmark Us Now!
New, high-quality worksheets are added every week! Do not miss out!