Graphing Density
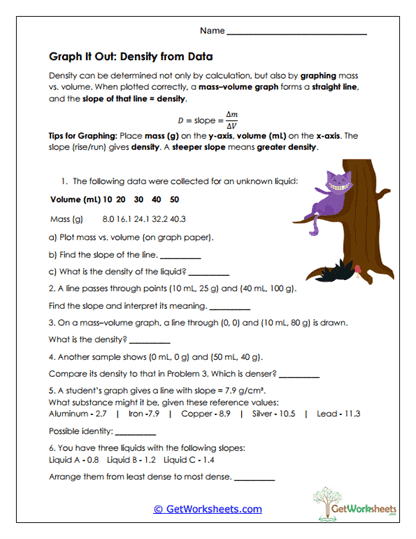
This worksheet supports students in Grades 6, 7, and 8 as they connect mathematical graphing skills with scientific understanding of density, linear relationships, and data interpretation. Learners plot mass versus volume data, draw best-fit lines, and interpret slope as density, strengthening graphing accuracy, analytical reasoning, and the ability to apply formulas to experimental findings.
Academic Focus
- Graphing Density Relationships (Grades 6-8)
Students determine density by graphing mass versus volume and interpreting the slope. - Slope & Linear Reasoning
Learners analyze linear relationships and connect slope to real-world scientific meaning. - Data Visualization & Interpretation
Activities emphasize accurate plotting, trend analysis, and comparison across datasets. - Experimental Data Analysis
Students use graphical evidence to identify materials and explain scientific conclusions.
Instructional Benefits
- Teacher-Created Resource
Designed by educators to align with middle school math and physical science standards. - Strong Math-Science Integration
Connects algebraic concepts like slope with hands-on scientific reasoning. - Builds Graph Literacy
Reinforces best-fit lines, scale selection, and interpretation of visual data. - Flexible Classroom Use
Ideal for science labs, math integration lessons, homework, review, or assessment prep. - Printable & No-Prep
Easy to implement in classrooms or homeschool environments.
This graphing density worksheet helps students deepen understanding of density through visual data analysis and linear reasoning. By interpreting slopes and comparing graphs, learners strengthen skills in graphing, scientific explanation, and quantitative thinking. Whether used in a classroom or homeschool setting, this printable resource provides meaningful practice connecting experimental data to mathematical models and physical science concepts.
This worksheet is part of our Density collection.
Bookmark Us Now!
New, high-quality worksheets are added every week! Do not miss out!