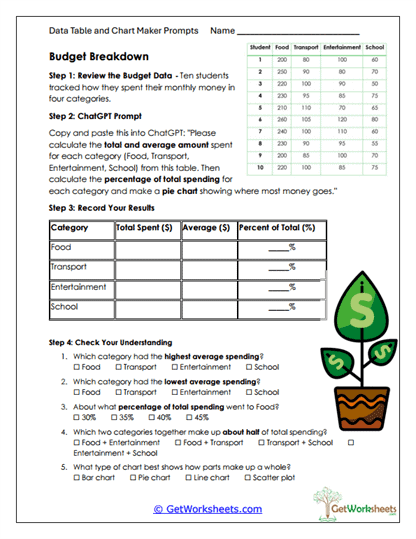
Budget Breakdown
This worksheet is designed for students in Grades 5, 6, and 7 to strengthen skills in analyzing financial data through totals, averages, and percentages. By working with monthly spending information across multiple categories, learners practice multi-step calculation, proportional reasoning, data interpretation, and pie chart analysis while using AI as a guided tool to organize and process numerical information accurately.
Learning Goals
- Totals and Averages (Grades 5-7) – Students calculate category totals and mean spending values from multi-student datasets.
- Percentages & Proportional Reasoning – Learners convert totals into percentages to understand parts of a whole.
- Pie Chart Representation – Students create and interpret pie charts to visualize proportional relationships clearly.
- Financial Data Analysis – Learners compare categories to identify highest, lowest, and relative spending patterns.
Instructional Benefits
- Teacher-Created Resource – Designed by educators with upper-elementary and middle school standards in mind.
- Real-World Financial Context – Uses budgeting scenarios to make math concepts practical and relevant.
- Flexible Use Options – Suitable for classwork, independent practice, small groups, enrichment, or homework.
- Supports Multiple Learners – Combines computation, visual models, and written analysis questions.
- AI Integration – Models responsible AI use for handling multi-step calculations and organizing results.
This printable worksheet helps students build confidence with totals, averages, percentages, and proportional reasoning through meaningful financial data analysis. Learners strengthen skills in numerical reasoning, pie chart interpretation, and comparison thinking while gaining experience using AI to support structured problem-solving. Ideal for both classroom and homeschool use, this no-prep resource reinforces essential math and financial literacy skills in a clear, engaging format.
This worksheet is part of our AI Data Table and Chart Makers Worksheets collection.

Bookmark Us Now!
New, high-quality worksheets are added every week! Do not miss out!