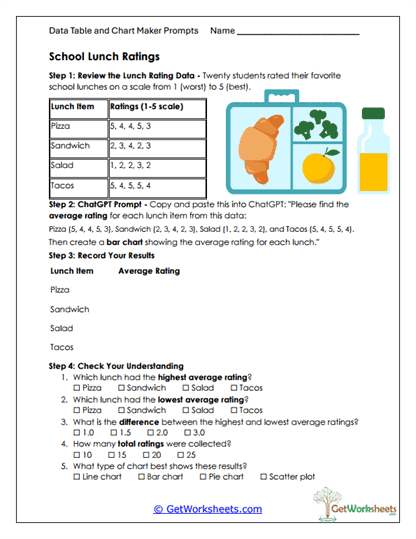
School Lunch Ratings
This worksheet is designed for students in Grades 4, 5, and 6 to practice calculating averages, interpreting numerical ratings, and analyzing real-world data. By working with school lunch rating scores on a 1-5 scale, students develop skills in mean calculation, data organization, bar graph creation, and comparison reasoning while learning how AI tools can support multi-step mathematical tasks and data visualization.
Learning Goals
- Mean Calculation (Grades 4-6) – Students compute average ratings from multiple data points using addition and division.
- Interpreting Rating Scales – Learners analyze numerical ratings to understand variation, consistency, and overall trends.
- Bar Graph Representation – Students create and read bar charts to compare average lunch ratings clearly.
- AI-Supported Data Analysis – Guided prompts show students how AI can assist with calculations and organizing results.
Instructional Benefits
- Educator-Created Resource – Designed by teachers to align with upper elementary math standards.
- Real-Life Application – Uses familiar lunch choices to make averages and data analysis meaningful.
- Flexible Classroom Use – Suitable for independent work, small groups, math centers, or homework.
- Supports Different Learners – Combines computation, visual graphs, and written reasoning questions.
- Technology Integration – Models responsible AI use as a learning aid rather than a shortcut.
This printable worksheet helps students strengthen understanding of averages, numerical reasoning, and data comparison through an engaging, real-world context. Learners practice identifying highest and lowest values, analyzing differences in data, and explaining trends using both numbers and graphs. Ideal for classroom or homeschool use, this no-prep activity builds confidence with data analysis while reinforcing how AI can support clear and accurate mathematical thinking.
This worksheet is part of our AI Data Table and Chart Makers Worksheets collection.

Bookmark Us Now!
New, high-quality worksheets are added every week! Do not miss out!