Recess Fun-o-Meter
This worksheet helps students in Grades 2, 3, and 4 practice collecting, organizing, and interpreting categorical data using a fun and familiar topic: recess activities. Through survey analysis, frequency tables, bar graphs, comparison questions, and data reasoning, learners strengthen math skills related to data representation, graph reading, trend analysis, and careful interpretation while also gaining experience using AI as a supportive learning tool.
Learning Goals
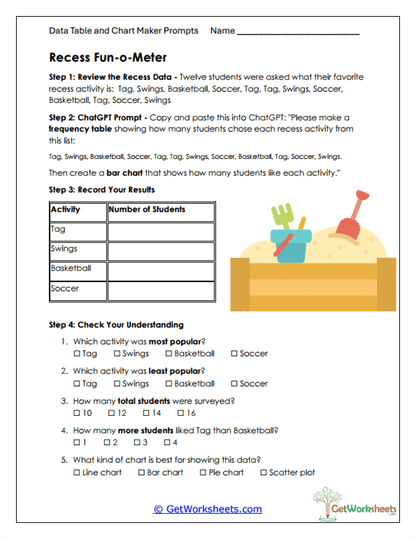
- Categorical Data Analysis (Grades 2-4) – Students organize raw survey responses into a clear frequency table to identify totals and categories.
- Bar Graph Creation & Interpretation – Learners translate data into a bar graph and practice reading labels, scales, and quantities accurately.
- Comparing Data Sets – Students determine most popular, least popular, and equal categories using numerical reasoning.
- AI-Supported Data Organization – Students use a guided ChatGPT prompt to assist with building tables and charts responsibly.
Instructional Benefits
- Teacher-Created Resource – Designed by educators with grade-level expectations and standards in mind.
- Flexible Use – Works well for classwork, small groups, independent practice, or homework.
- Low-Prep Format – Ready-to-use structure with clear directions and student-friendly prompts.
- Supports Multiple Learners – Combines visual graphs, numerical data, and written reasoning.
- Technology Integration – Encourages thoughtful use of AI as a math-support tool, not a shortcut.
This printable worksheet builds confidence with frequency tables, bar graphs, categorical data, and data-driven comparisons in an engaging, age-appropriate way. Students strengthen graph interpretation, numerical reasoning, trend identification, and problem-solving skills while learning how AI can assist with organizing information. Ideal for both classroom instruction and homeschool settings, this activity supports foundational data literacy in a clear, structured, and meaningful format.
This worksheet is part of our AI Data Table and Chart Makers Worksheets collection.

Bookmark Us Now!
New, high-quality worksheets are added every week! Do not miss out!