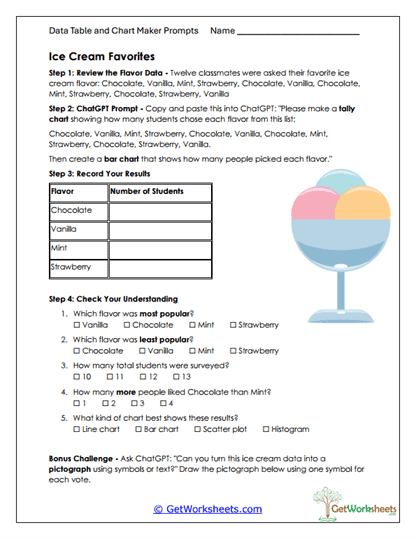
Ice Cream Favorites
This worksheet helps students in Grades 3, 4, and 5 build foundational math, data literacy, and critical thinking skills by analyzing real-world survey results about favorite ice cream flavors. Learners organize raw data into a tally chart with support from a guided ChatGPT prompt, then use those results to create and interpret a bar graph.
Learning Goals
- Data Collection & Representation (Grades 3-5) – Organizing survey results into clear tally charts
- Reading & Interpreting Graphs – Analyzing bar graphs to identify most and least popular choices
- Counting & Totaling Skills – Determining totals and comparing category quantities
- Technology Literacy – Using AI tools to assist with organizing and summarizing data
Instructional Benefits
- Teacher-Created Resource – Designed to align with early elementary math and data standards
- Student-Friendly Context – Uses ice cream flavors to make data analysis engaging and relatable
- Guided AI Collaboration – Models appropriate, supportive use of ChatGPT for organizing information
- Multiple-Choice Comprehension Questions – Reinforces understanding of charts and totals
- Low-Prep Format – Easy to print and use in classroom or homeschool settings
This printable worksheet helps students strengthen counting, organization, and data interpretation skills while gaining early experience with data visualization. By creating tally charts and bar graphs from raw survey results, learners build confidence in reading and analyzing visual displays. It is a fun, practical resource for classroom and homeschool instruction focused on data representation, inference, and responsible use of AI as a learning tool.
This worksheet is part of our AI Data Table and Chart Makers Worksheets collection.

Bookmark Us Now!
New, high-quality worksheets are added every week! Do not miss out!