Classroom GPA Study
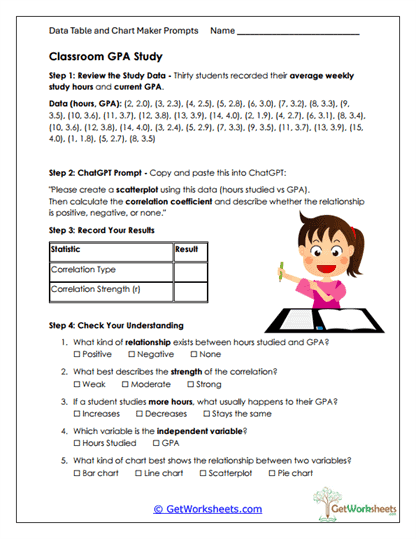
This worksheet helps students in Grades 7, 8, and 9 build core statistics, data analysis, and critical thinking skills by exploring the relationship between weekly study hours and GPA. Learners work with a bivariate dataset of thirty students, use a guided ChatGPT prompt to generate a scatterplot, calculate a correlation coefficient, and interpret the strength and direction of the relationship between variables.
Learning Goals
- Statistics & Data Analysis (Grades 7-9) – Understanding scatterplots and correlation in real-world contexts
- Two-Variable Data Representation – Graphing and analyzing relationships between independent and dependent variables
- Technology Literacy – Using AI tools to generate scatterplots and compute correlation values
- Critical Thinking – Interpreting correlation type, strength, and limitations
Instructional Benefits
- Teacher-Created Resource – Designed to align with middle school and early high school math standards
- Realistic Dataset – Uses GPA and study hours to make abstract concepts concrete
- Guided AI Integration – Models appropriate and purposeful use of AI for data analysis
- Comprehension Questions Included – Reinforces interpretation beyond calculations
- Low-Prep Format – Easy to implement in classrooms or homeschool settings
This printable worksheet supports students in developing confidence with scatterplots, correlation coefficients, and interpretation of two-variable data. By combining hands-on analysis with responsible AI use, learners strengthen both mathematical reasoning and technology literacy. It is a practical, standards-aligned resource for classroom and homeschool instruction focused on statistics, data relationships, and informed use of AI in math learning.
This worksheet is part of our AI Data Table and Chart Makers Worksheets collection.

Bookmark Us Now!
New, high-quality worksheets are added every week! Do not miss out!