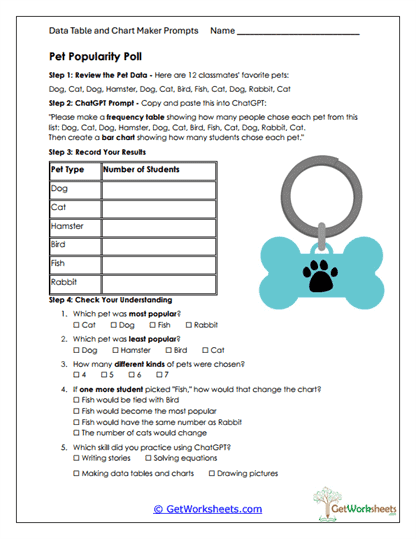
Pet Popularity Poll
This worksheet helps students in Grades 4, 5, and 6 build foundational data analysis, graphing, and critical thinking skills by working with real-world categorical data. Learners organize raw pet preference responses into a frequency table, use a guided ChatGPT prompt to generate a bar chart, and analyze the results to compare categories and draw conclusions.
Learning Goals
- Categorical Data Representation (Grades 4-6) – Organizing survey data into clear frequency tables
- Bar Graph Creation & Analysis – Interpreting bar charts to identify most and least popular categories
- Data Comparison Skills – Comparing quantities and explaining differences between categories
- Technology Literacy – Using AI tools to support data visualization and problem-solving
Instructional Benefits
- Teacher-Created Resource – Designed to align with upper-elementary math and data standards
- Realistic Data Scenario – Uses familiar pet preferences to make data analysis engaging and accessible
- Guided AI Integration – Models appropriate use of ChatGPT for generating charts from data
- Comprehension Questions Included – Reinforces understanding beyond graph creation
- Low-Prep Format – Easy to print and use in classroom or homeschool settings
This printable worksheet helps students strengthen skills in organizing information, interpreting visual data, and analyzing categorical results. By combining hands-on table creation with AI-assisted graphing, learners gain confidence in both mathematical reasoning and responsible technology use. It is a practical, engaging resource for classroom and homeschool instruction focused on data literacy, visualization, and drawing meaningful conclusions from information.
This worksheet is part of our AI Data Table and Chart Makers Worksheets collection.

Bookmark Us Now!
New, high-quality worksheets are added every week! Do not miss out!