Car Speed Study
This worksheet is designed for students in Grades 7, 8, and 9 to deepen understanding of statistical analysis using real-world speed data collected near a school. Students apply concepts such as mean, median, mode, standard deviation, frequency tables, and histograms while practicing numerical reasoning, data organization, and interpretation of variability, trends, and patterns through structured AI-supported analysis.
Learning Goals
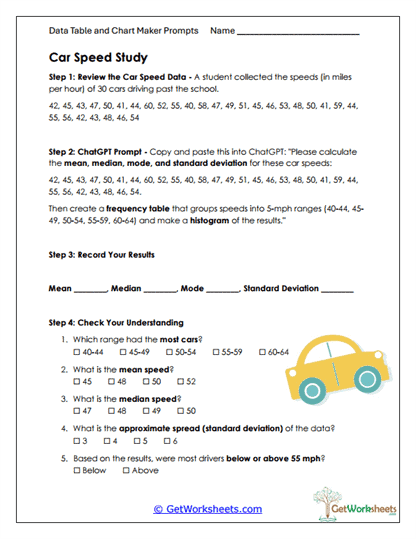
- Measures of Center (Grades 7-9) – Students calculate and compare mean, median, and mode to describe typical car speeds.
- Measures of Variability – Learners compute and interpret standard deviation to understand spread and consistency in data.
- Frequency Tables & Histograms – Students group data into equal intervals and analyze distributions using histograms.
- Real-World Data Interpretation – Learners draw conclusions about driver behavior, speed ranges, and safety patterns.
Instructional Benefits
- Teacher-Created Resource – Developed by educators with middle school and early high school standards in mind.
- Authentic Context – Uses realistic traffic data to make abstract statistics meaningful and relevant.
- Flexible Classroom Use – Suitable for independent work, guided instruction, enrichment, or assessment practice.
- Supports Different Learners – Combines computation, visual data displays, and written reasoning questions.
- Technology Integration – Models responsible AI use for statistical calculations and graph generation.
This printable worksheet helps students strengthen skills in statistical measures, variability, frequency analysis, and data visualization through a practical, real-world scenario. Learners build confidence interpreting numerical and graphical data, comparing central tendencies, and explaining patterns using evidence. Ideal for classroom or homeschool use, this no-prep activity supports deeper understanding of statistics while demonstrating how AI can assist with complex data analysis tasks.
This worksheet is part of our AI Data Table and Chart Makers Worksheets collection.
Bookmark Us Now!
New, high-quality worksheets are added every week! Do not miss out!