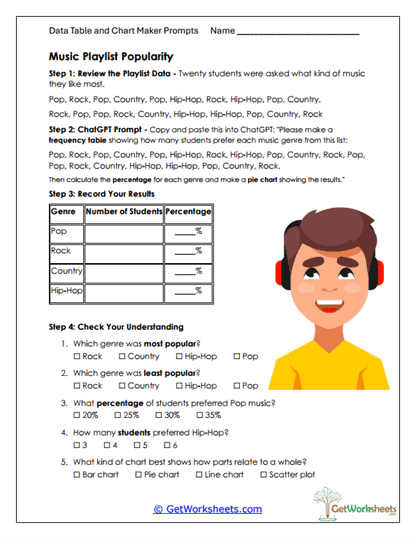
A Music Playlist Popularity
This worksheet helps students in Grades 4, 5, and 6 build skills in analyzing survey data, calculating percentages, and interpreting visual representations through a relatable topic: music preferences. By working with genre survey results, learners practice proportional reasoning, frequency tables, percentage calculations, bar graph creation, and data comparison while learning how AI tools can assist with organizing and computing multi-step data tasks clearly and accurately.
Learning Goals
- Percentages & Proportional Reasoning (Grades 4-6) – Students calculate percentages based on survey totals and connect fractions, decimals, and percents.
- Frequency Tables – Learners organize raw survey data into structured tables showing counts and proportions.
- Bar Graph Representation – Students create and interpret bar charts to compare genre popularity visually.
- Survey Data Analysis – Learners rank categories, identify trends, and explain differences using numerical evidence.
Instructional Benefits
- Teacher-Created Resource – Designed by educators to align with upper-elementary math standards.
- High-Interest Context – Uses music genres to make percentages and data analysis engaging and meaningful.
- Flexible Use – Suitable for whole-class lessons, independent practice, math centers, or homework.
- Multiple Learning Modes – Combines numerical work, tables, graphs, and written reasoning.
- Technology Integration – Models responsible AI use for calculating percentages and organizing data.
This printable worksheet strengthens understanding of percentages, proportional reasoning, data representation, and visual interpretation through structured practice. Students gain confidence analyzing survey results, comparing popularity trends, and explaining their reasoning using both numbers and graphs. Ideal for classroom or homeschool use, this no-prep activity supports essential math skills while demonstrating how AI can efficiently support data organization and calculation.
This worksheet is part of our AI Data Table and Chart Makers Worksheets collection.
Bookmark Us Now!
New, high-quality worksheets are added every week! Do not miss out!