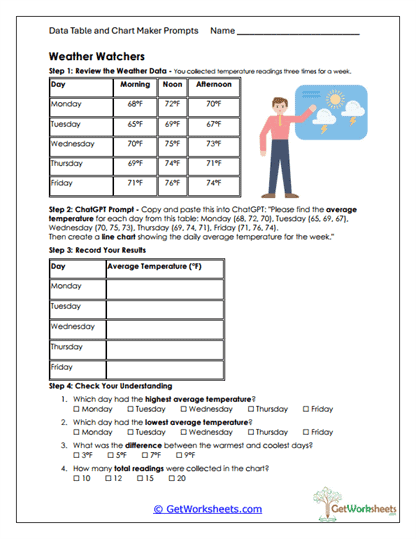
Weather Watchers
This worksheet supports students in Grades 4, 5, and 6 as they practice calculating averages, organizing numerical data, and interpreting results using real-world weather information. By working with daily temperature readings, learners strengthen skills in multi-step calculation, data comparison, trend analysis, and bar graph interpretation while thoughtfully using AI to assist with organizing and visualizing information.
Learning Goals
- Computing Averages (Grades 4-6) – Students calculate daily average temperatures from multiple data points using addition and division.
- Numerical Data Interpretation – Learners analyze temperature values to identify highest, lowest, and changing patterns across days.
- Bar Graph Representation – Students create and read bar charts to visually compare daily averages.
- AI-Assisted Problem Solving – Guided use of ChatGPT helps students complete structured calculations and display results clearly.
Instructional Benefits
- Teacher-Designed Activity – Created with grade-level math standards and classroom pacing in mind.
- Real-World Context – Uses familiar weather data to make averages and data analysis meaningful.
- Flexible Implementation – Suitable for whole-class lessons, independent practice, math centers, or homework.
- Supports Diverse Learners – Combines computation, visual graphs, and written reasoning.
- Technology Integration – Encourages responsible AI use for checking work and organizing data.
This Weather Watchers worksheet helps students build confidence with averages, numerical reasoning, and data visualization through an engaging, real-life scenario. Learners practice comparing values, identifying trends, and explaining their thinking using both numbers and graphs. Whether used in a classroom or homeschool setting, this no-prep resource strengthens core math skills while modeling how AI can support careful, multi-step data analysis.
This worksheet is part of our AI Data Table and Chart Makers Worksheets collection.
Bookmark Us Now!
New, high-quality worksheets are added every week! Do not miss out!